This residential coverage analysis estimates the number of inhabitants within ½ mile of each station on the MAX Yellow Line and each bus stop of the inbound and outbound Route 2 bus. Understanding how many people live and quick access to transit is crucial to understanding and predicting ridership, measuring the appropriateness of bus stop location and spacing, and assessing myriad other factors that play into difficult decisions regarding transit investment and planning. The interactive map and charts I created allow users to explore and understand this important statistic, and give them the ability to pinpoint bus stops that have exceptionally low or high residential coverage.
Methodology
From downloading the Census block group level population data, to creating the final data outputs, interactive maps, and charts, this entire process has been coded using open source tools in Python and Javascript. The code used in this analysis can be viewed on Github. There are many advantages to using code to conduct the analysis. The main advantage is scalability. The code used for this analysis can be used to quickly conduct the same analysis for any transit system in the world. The code is well documented, and the code itself is documentation of the process. This allows the work to be replicated, peer reviewed, and checked for quality assurance. The code can be leveraged across projects, across time and geographies, and can be further developed into increasingly complex analyses, interactive applications or web tools.
The following steps were taken in the analysis:
- First, Python was used to download the 2019 5-year American Community Survey (ACS) population data at the block group level from the Census API, and merge the population data with the Census block group level geographies.
- Next, I used OSMnx to download and process a topological street network for Multnomah County, and create isochrones for each transit stop that approximate 1/2 miles distance traveling along the walkable street network.
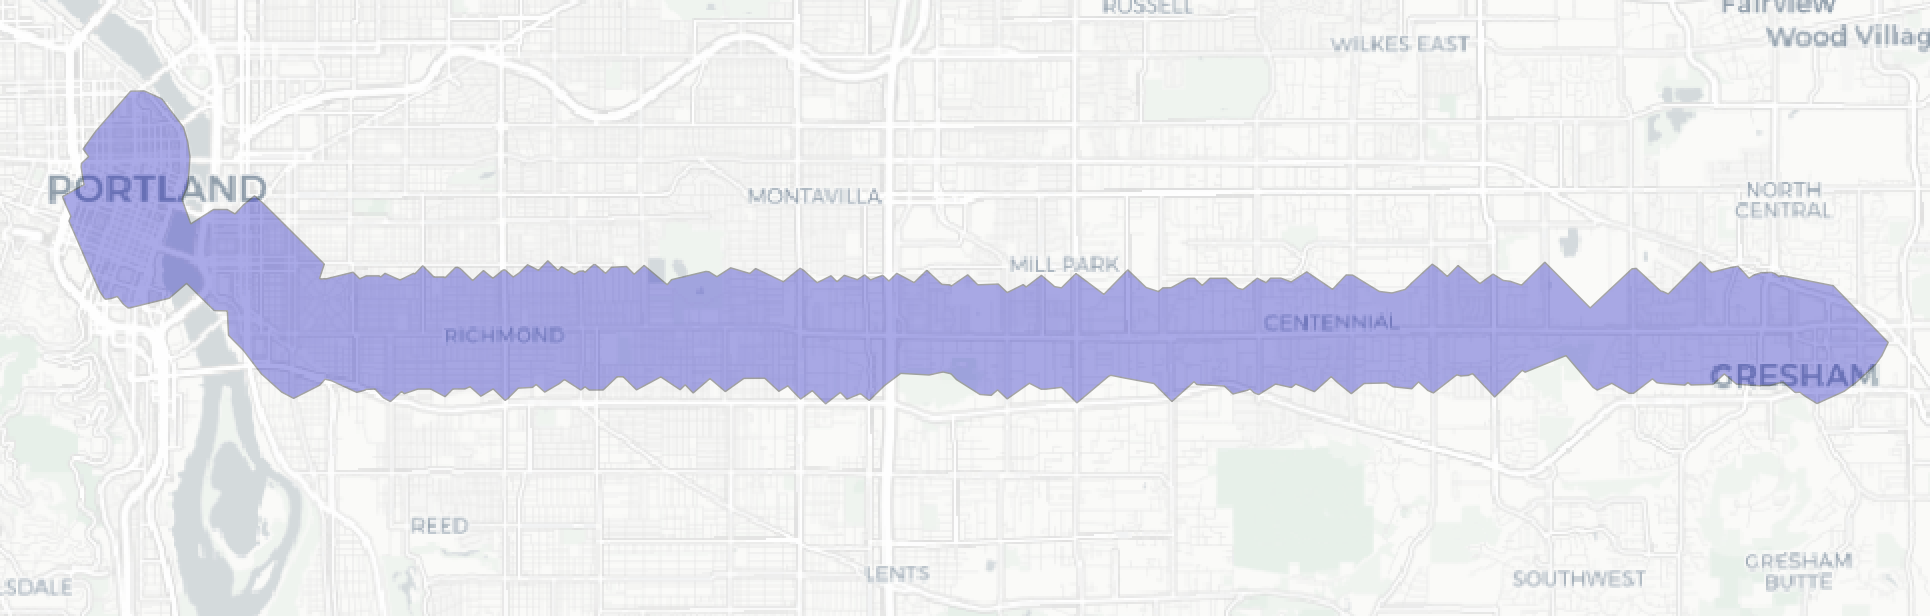
- The isochrones are dissolved, resulting in polygons that represent everywhere that is within 1/2 mile travel on the walkable network from any of the transit stops on the route. Below is an image of the dissolved isochrones for the outbound Route 2 bus:
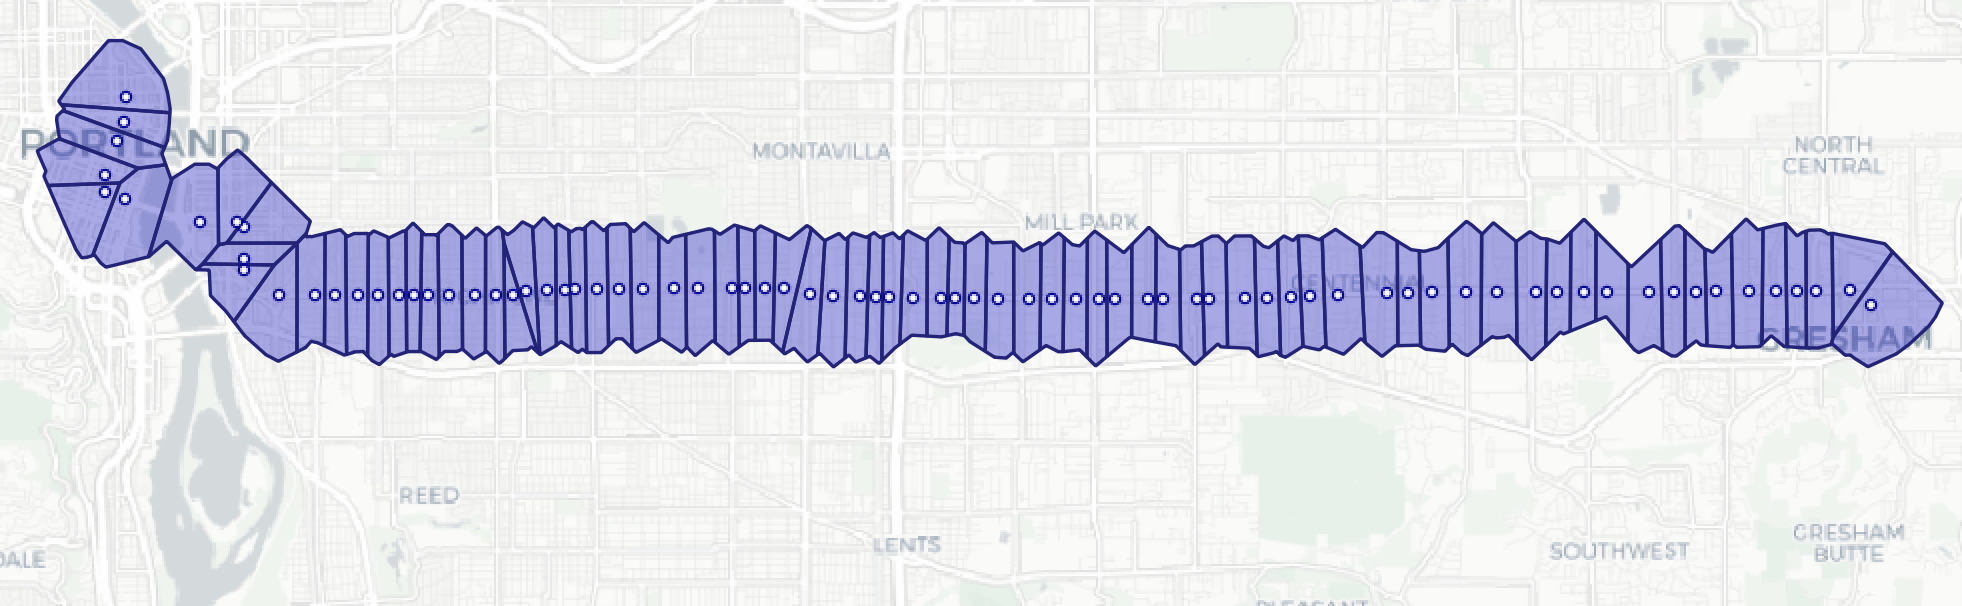
- The area within the dissolved isochrones is next split into Voronoi polygons. These polygons demarcate an area for each individual transit stop that consists of all points within the dissolved isochrone layer that are closer to that transit stop than to any other stop. This step ensures that residents living near two or more stops are not double counted. These polygons are the residential coverage areas for each transit stop. See an image of these areas below:
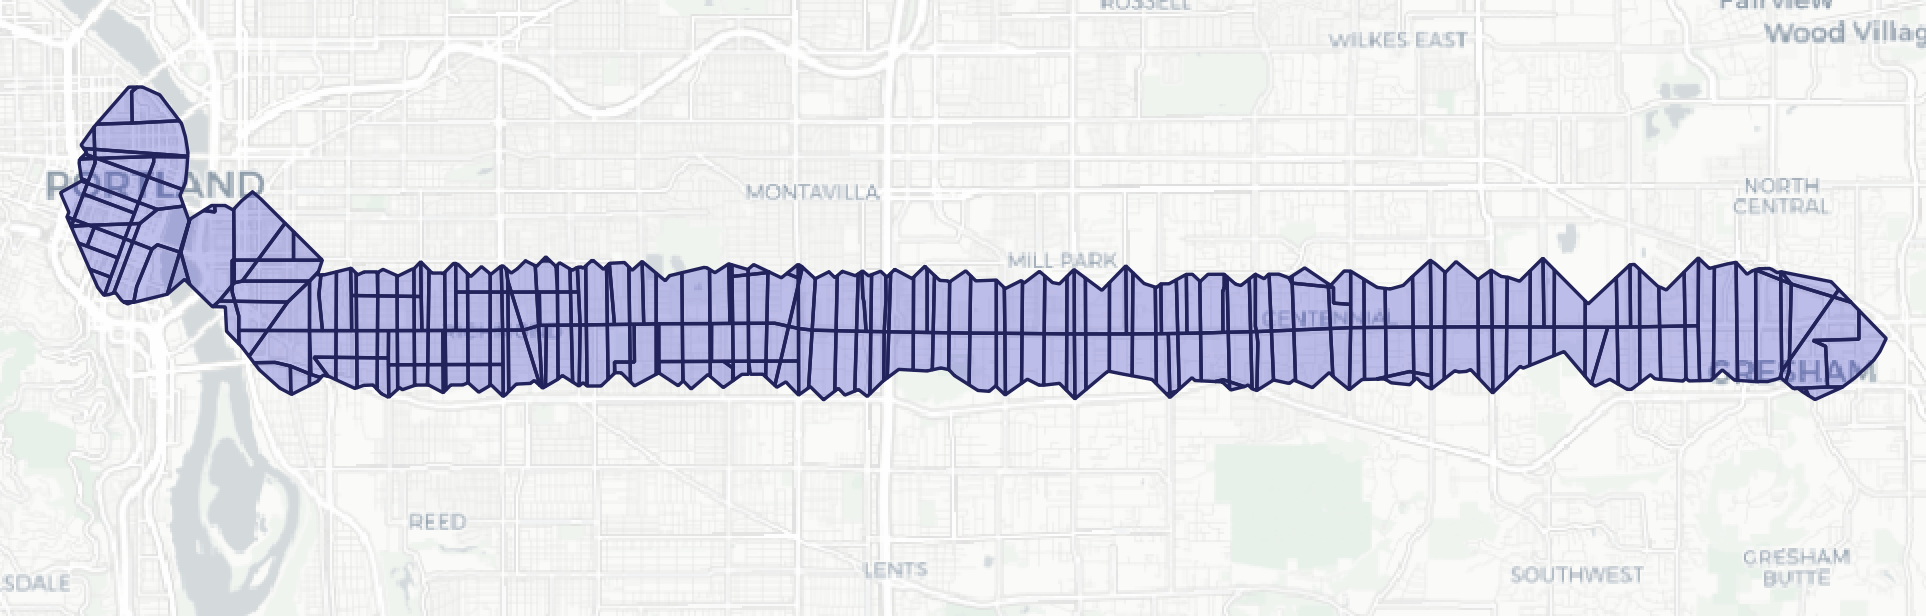
- The Census population data is at the block group level. The block group geographies do no align with the residential coverage areas created in earlier steps, and so additional step will need to be taken to estimate what proportion of the residents counted in the block groups live within the residential coverage areas. First, the block groups are clipped to the residential coverage areas, and the areal proportion of each block group falling fully or partially within the residential coverage areas is calculated. See an image below of the block group areas clipped to the residential coverage areas.
- Next, the total population figure for each block group is multiplied by the areal proportion calculated in step 6 above.
- For each residential coverage area, I summed the proportional population estimates of every block group falling within it. The resulting sum is the estimated number of people living within 1/2 mile network distance from each transit stop.
TriMet Residential Coverage Interactive Map
This map allows users to view the residential coverage of each transit stop. The residential coverage area for each stop is defined as the region around a given transit stop consisting of all points closer to that transit stop than any other transit stop on the same route, and within ½ mile network distance from the stop. Click on the layers button in the upper righthand corner to view different routes. Click on map features to view the residential coverage for each transit stop.
Code used in the analysis can be viewed at this Github Repository