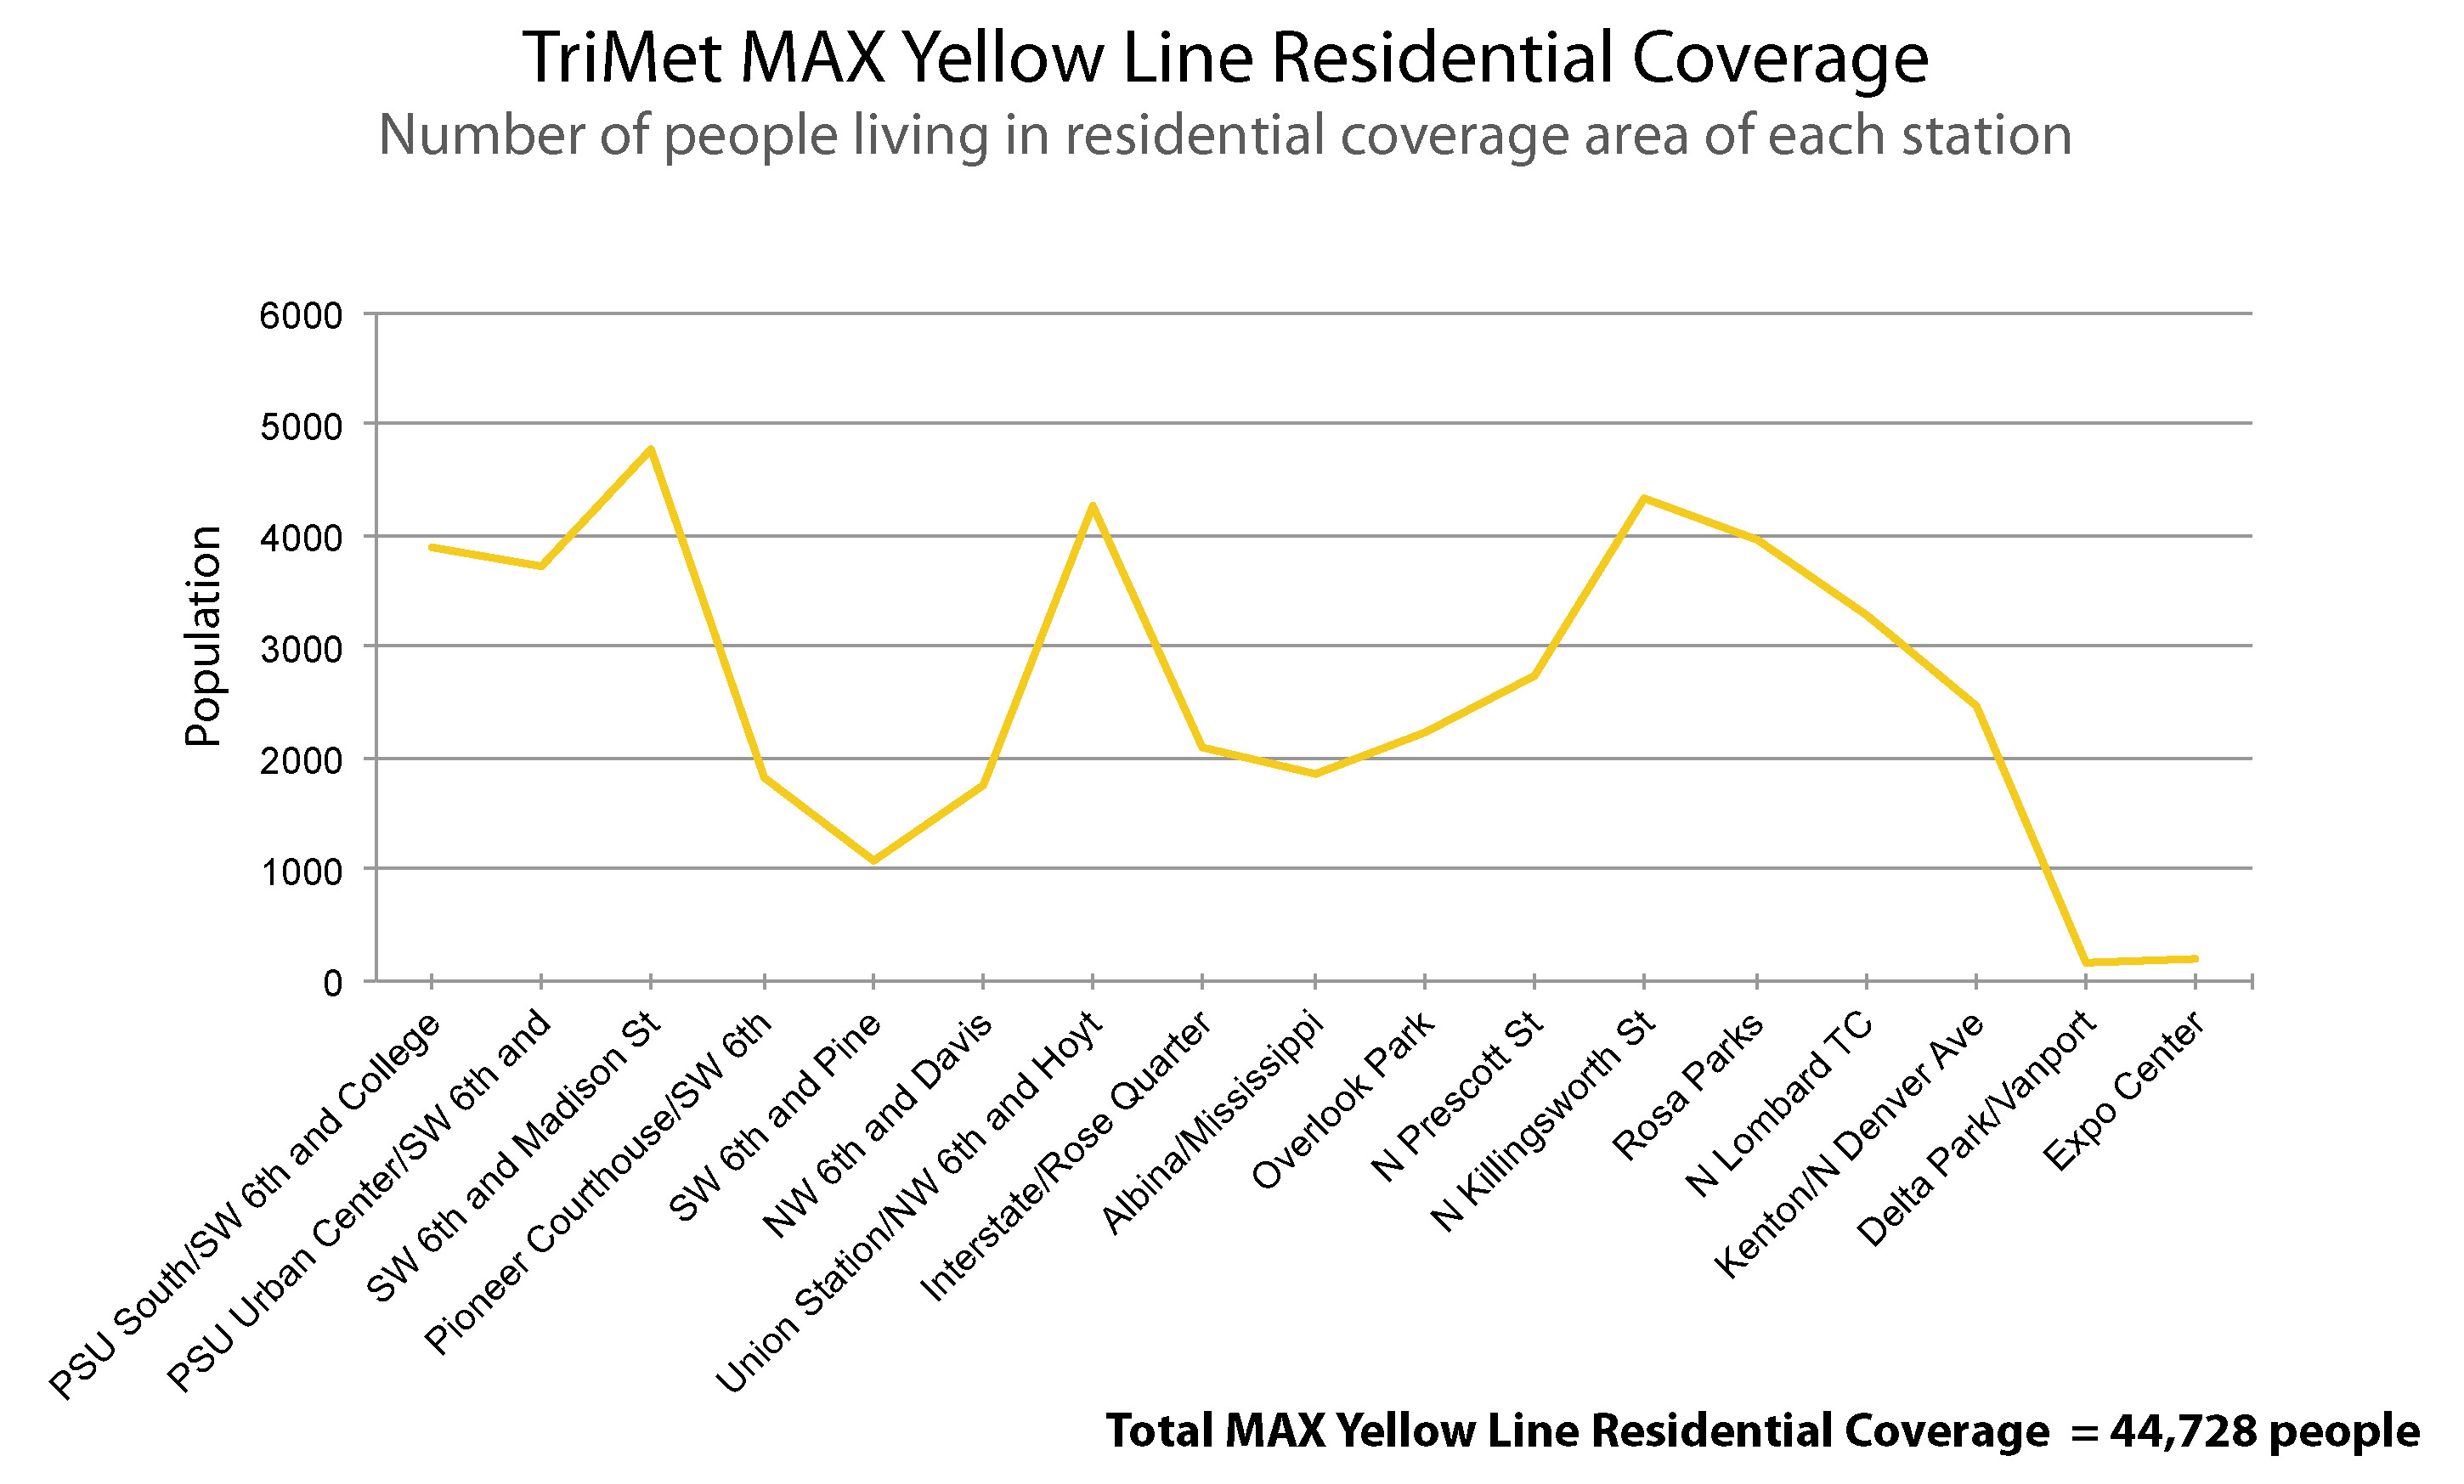
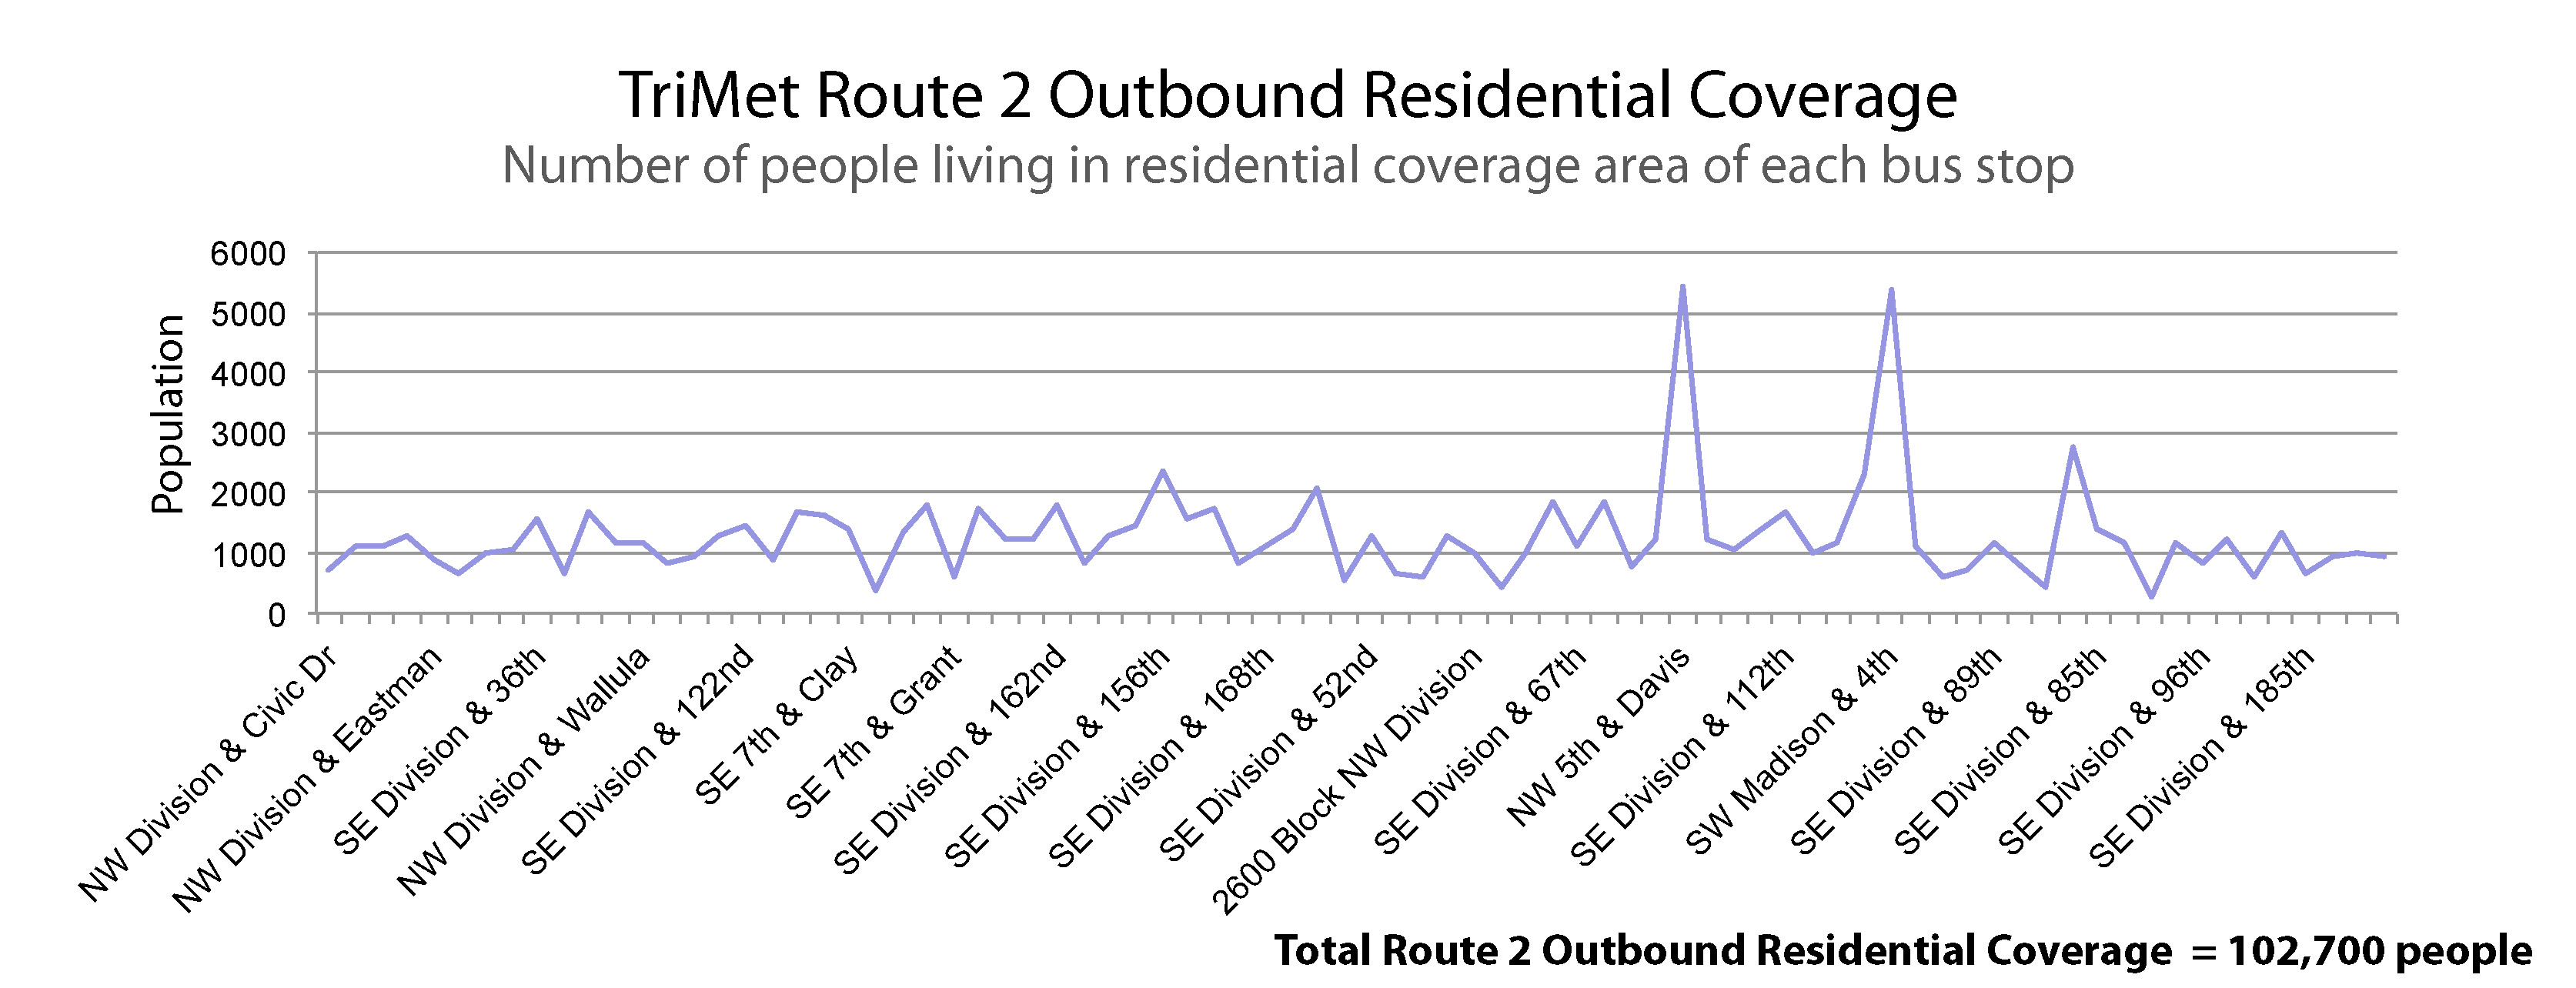
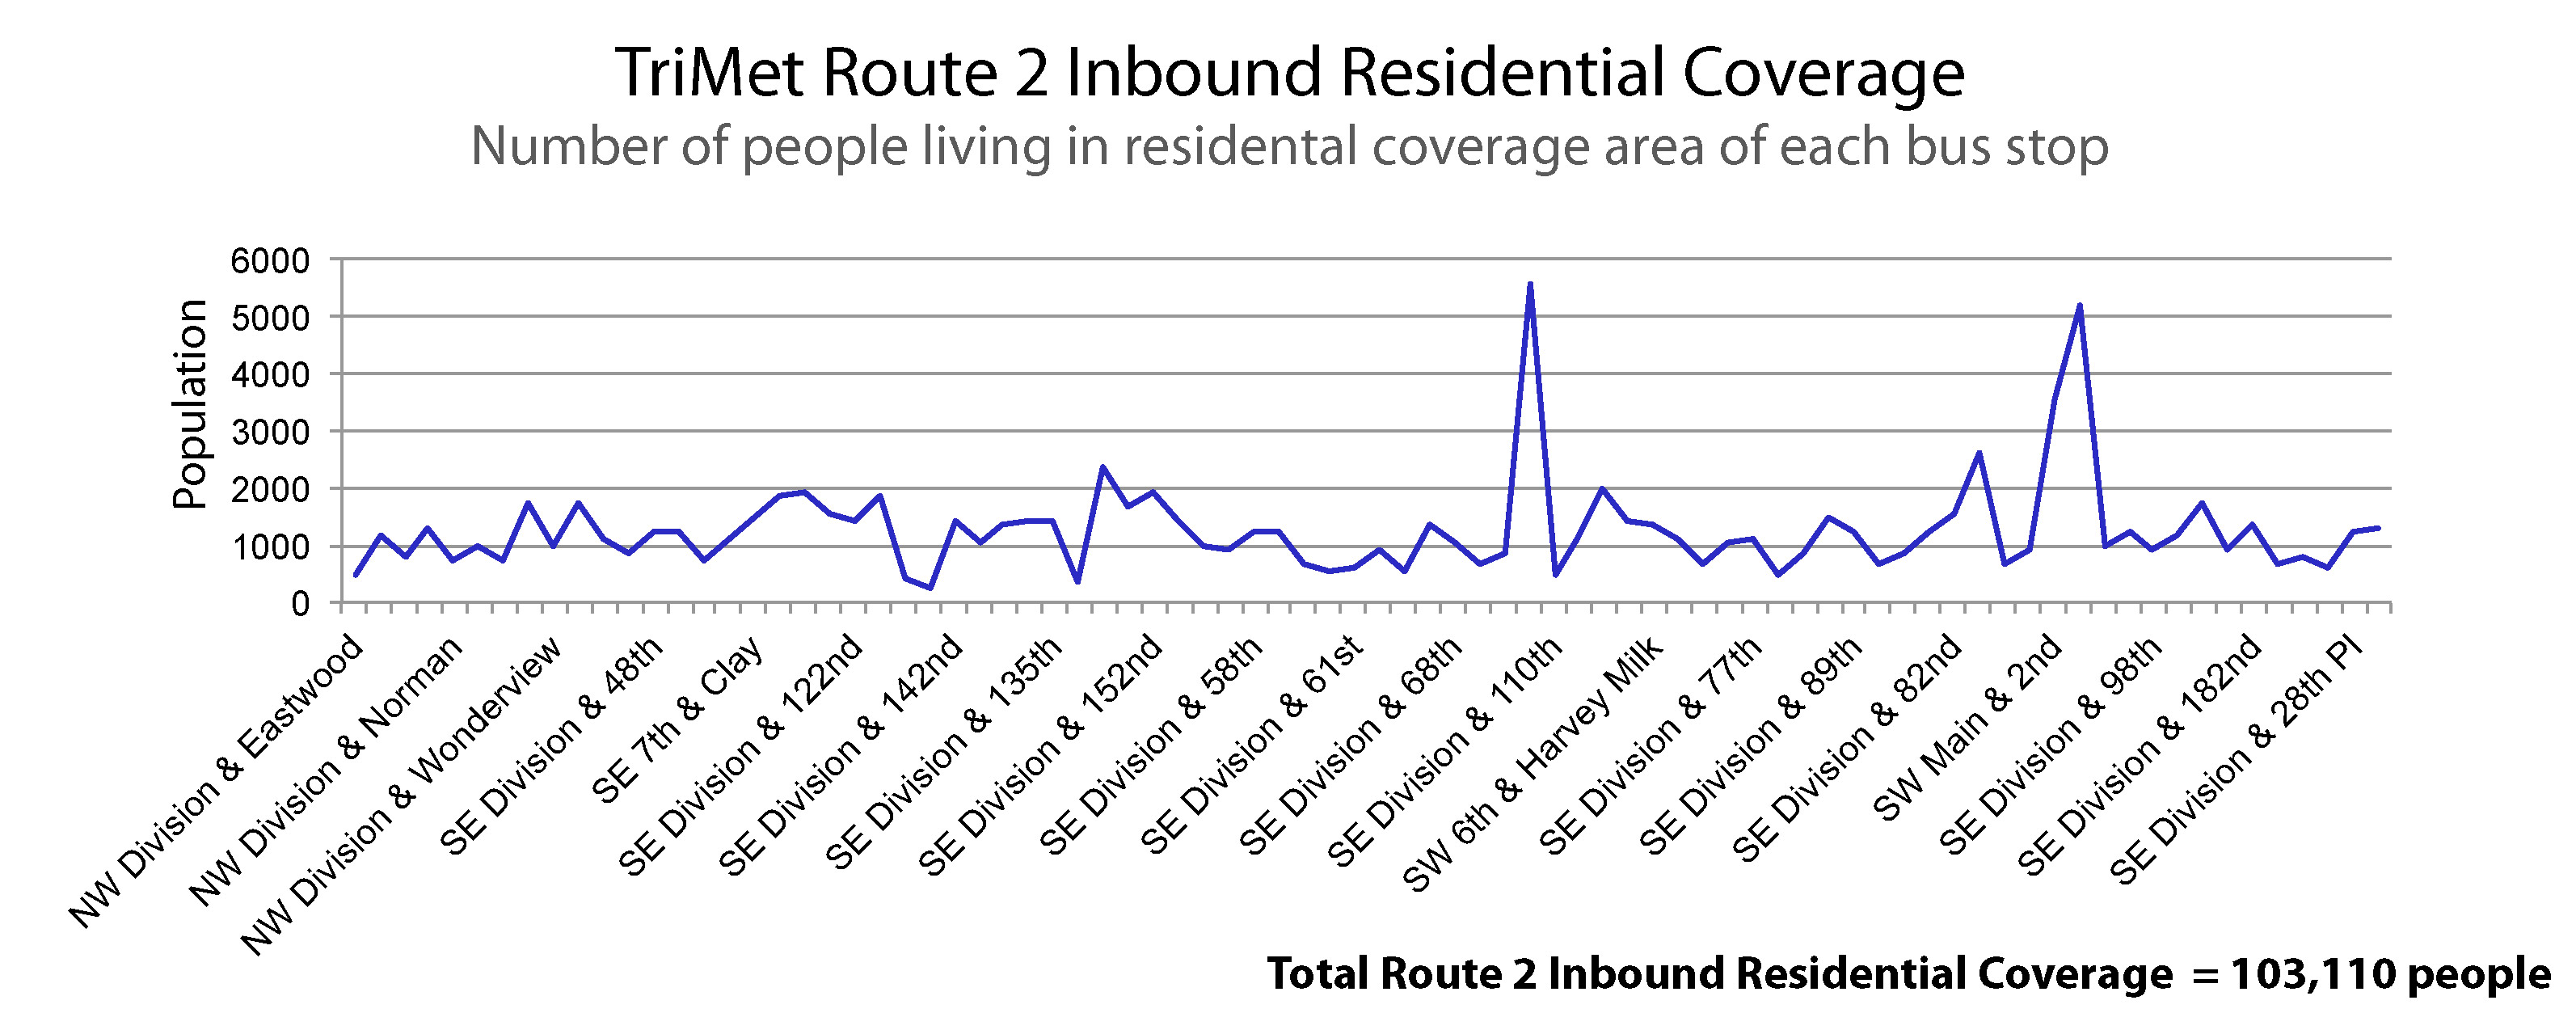
This residential coverage analysis estimates the number of inhabitants within ½ mile of each station on the MAX Yellow Line and each bus stop of the inbound and outbound Route 2 bus. Understanding how many people live near transit is crucial to understanding and predicting ridership, as well as making difficult decisions regarding transit investment and planning. The interactive map and charts I created help viewers understand this important statistic, and give them the ability to pinpoint bus stops that have exceptionally low or high residential coverage.
Challenges
The challenge of this project was creating a sound methodology for estimating the population within ½ mile of transit stops using population data that corresponds to census block groups, which have a significantly different geography than that of the ½ mile buffers.
Methodology
First, I created a ½ mile buffer around each transit stop. Although these buffer areas might seem like appropriate areas to use to calculate the residential coverage of each stop, many of them overlap with other buffer areas, which would mean that residents living in multiple, overlapping buffer areas would be counted multiple times, leading to poor estimates. To solve this issue, I dissolved all of the buffered areas into a single polygon for each transit route, and next generated Voronoi polygons using the transit stops. These polygons form a region around each transit stop consisting of all points closer to that transit stop than any other, elegantly dividing up the transit stop buffer area in a way that prevents double counting and mirrors the way people usually use the nearest viable stop when they take transit.
These Voronoi polygons, clipped to the ½ mile buffers, are the transit stop residential coverage areas. As mentioned earlier, the population data does not correspond to these polygons. To address this issue, I calculated the area for each of the spaces where the residential coverage areas overlap a given census block group, and divided that by the total area of the block group. Multiplying the total population of the block group by the result of this division produces a strong estimate of the population living within the overlapping areas. These areas and their respective population estimates are then aggregated to determine the total population within each transit stop residential coverage area.
TriMet Residential Coverage Interactive Map
This map allows users to view the residential coverage of each transit stop. The residential coverage area for each stop is defined as the region around a given transit stop consisting of all points closer to that transit stop than any other transit stop on the same route, and within ½ mile from the stop.