Long Island Rail Road and Metro-North Railroad
New York commuter rail benefits all New Yorkers
To better understand New York City’s commuter rail and the role it plays in regional transportation, we dug into a range of sources including census commute flow data, LIRR and MNR data from the FTA, board committee meeting materials, and news media.
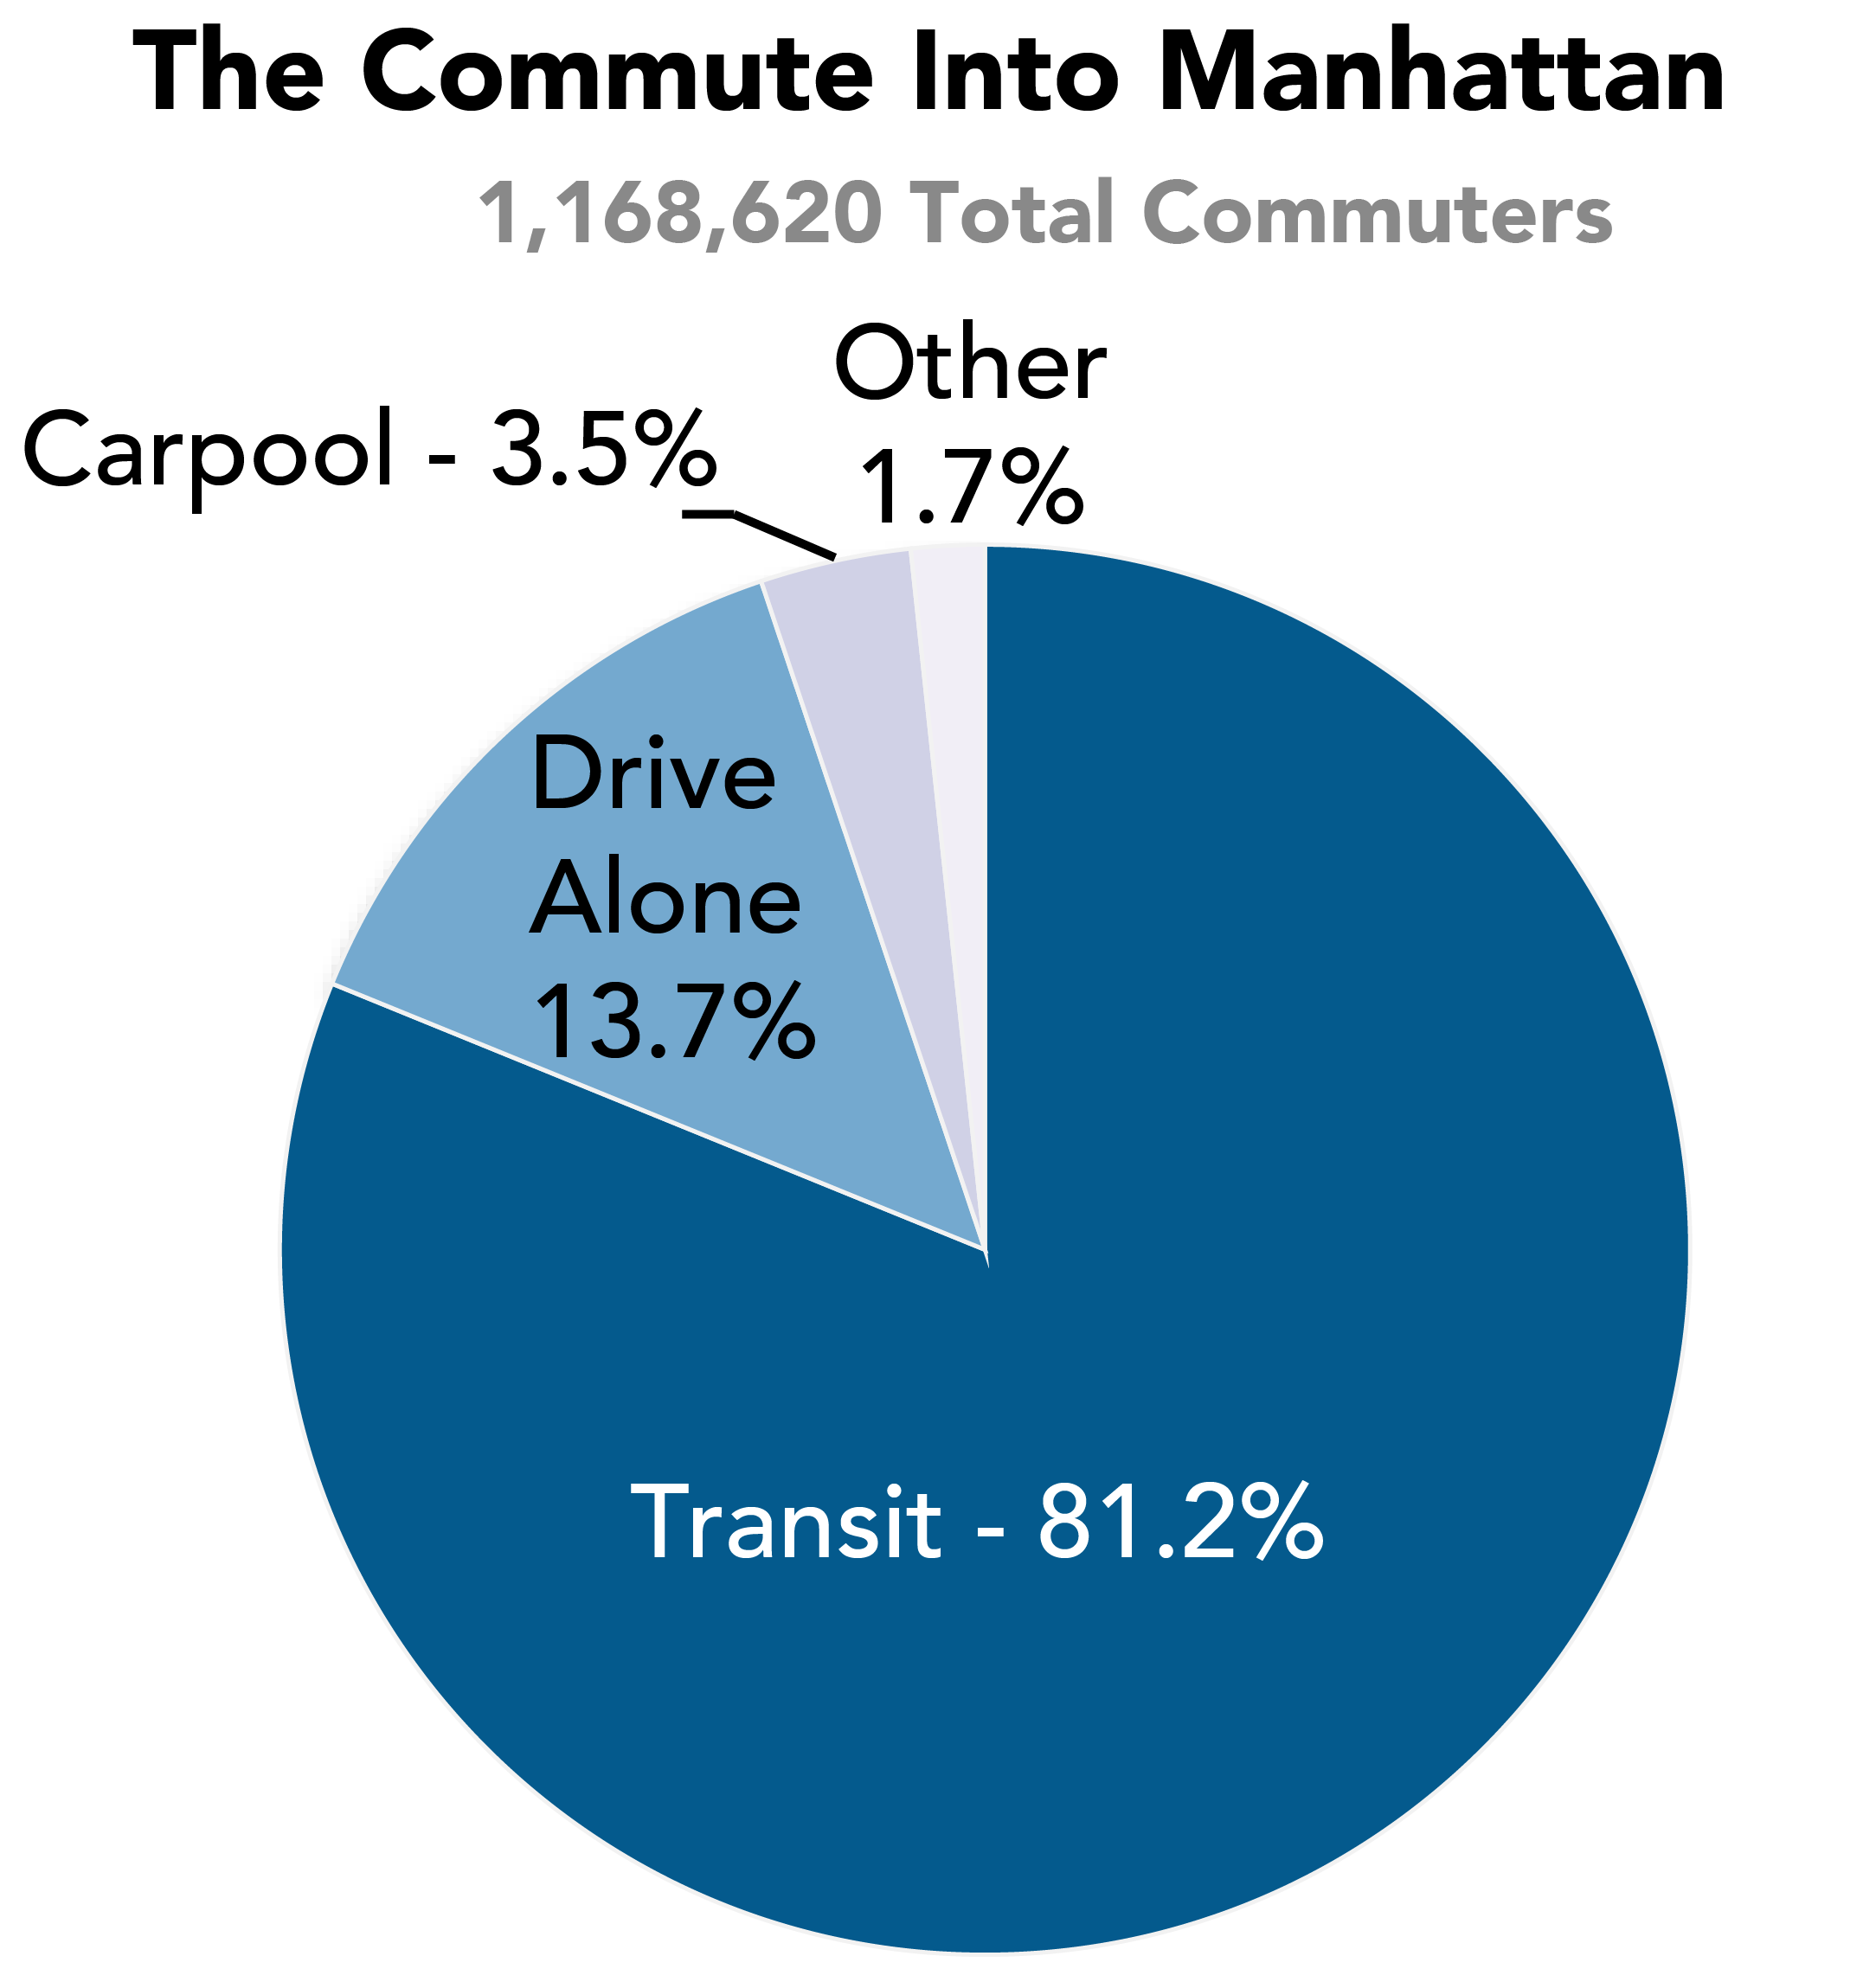
The Commute Into Manhattan
Mapping the impact of commuter rail
To understand the importance of the LIRR and MNR, it is necessary to view them in the context of the broader transportation network. The LIRR and MNR cover an extensive area with over 700 route miles combined, dozens of branches, and 248 stations. Combined, the MNR and LIRR brought 229,162 commuters into Grand Central Terminal and Penn Station on an average weekday in 2017. This is about 14 percent of the total number of people commuting into Manhattan. The interactive map we created below shows the number of people who commute into Manhattan from counties near and far. More importantly, it shows that the majority of people commuting into Manhattan depend on transit. The prohibitive costs of car ownership, insurance, gas, and storing a vehicle in Manhattan make driving to work infeasible for the majority people working in Manhattan. Even more prohibitive is the the limitation of physical space in Manhattan, which translates to high levels of traffic and scarcity of parking for drivers.
The Commute Into Manhattan Map below highlights the important role that transit, the LIRR, and the MNR play in regional transportation and access to Manhattan. The map visualizes ACS 2006-2010 Commute Flow data, and includes a hover feature that allows users to see the total number of people that commute into Manhattan from each county, and the percentage of these commuters that use transit. Less people commute into Manhattan from distant counties, but even in these cases a large percentage of commuters rely on transit. It should also be noted that the margin of error increases and accuracy of the data potentially decreases in counties with a smaller number people who commute into Manhattan.
Fund Long Island Rail Road and Metro-North Railroad
“The number one reason companies chose not to expand in New York was the condition of transportation infrastructure.” - Kathryn Wylde, the president of the Partnership for New York City
The majority of street space in Manhattan is dedicated to moving and storing private vehicles, only a small minority of people commuting into Manhattan do so in cars, and despite these facts, vehicle congestion has worsened in recent years, with Midtown core taxi speeds averaging a dismal 5 mph, (NYC Mobility Report). There is not enough space in Manhattan’s business district for the number of drivers entering today, and the number of people commuting into Manhattan is projected to grow. The LIRR and MNR are the most feasible way to carry such a large number of people into the city from areas they cover. This is evident in the fact that despite an increase in delays and train cancellations, LIRR and MNR ridership numbers have grown to their highest level in decades.
Addressing the challenges these systems face and ensuring that they have the funding they need to maintain their equipment, replace old, unreliable equipment, and complete their planned capital projects on schedule, benefits the city’s economic health and improves quality of life of people commuting from the suburbs and local residents alike.
Addressing the challenges these systems face and ensuring that they have the funding they need to maintain their equipment, replace old, unreliable equipment, and complete their planned capital projects on schedule, benefits the city’s economic health and improves quality of life of people commuting from the suburbs and local residents alike.
Challenges
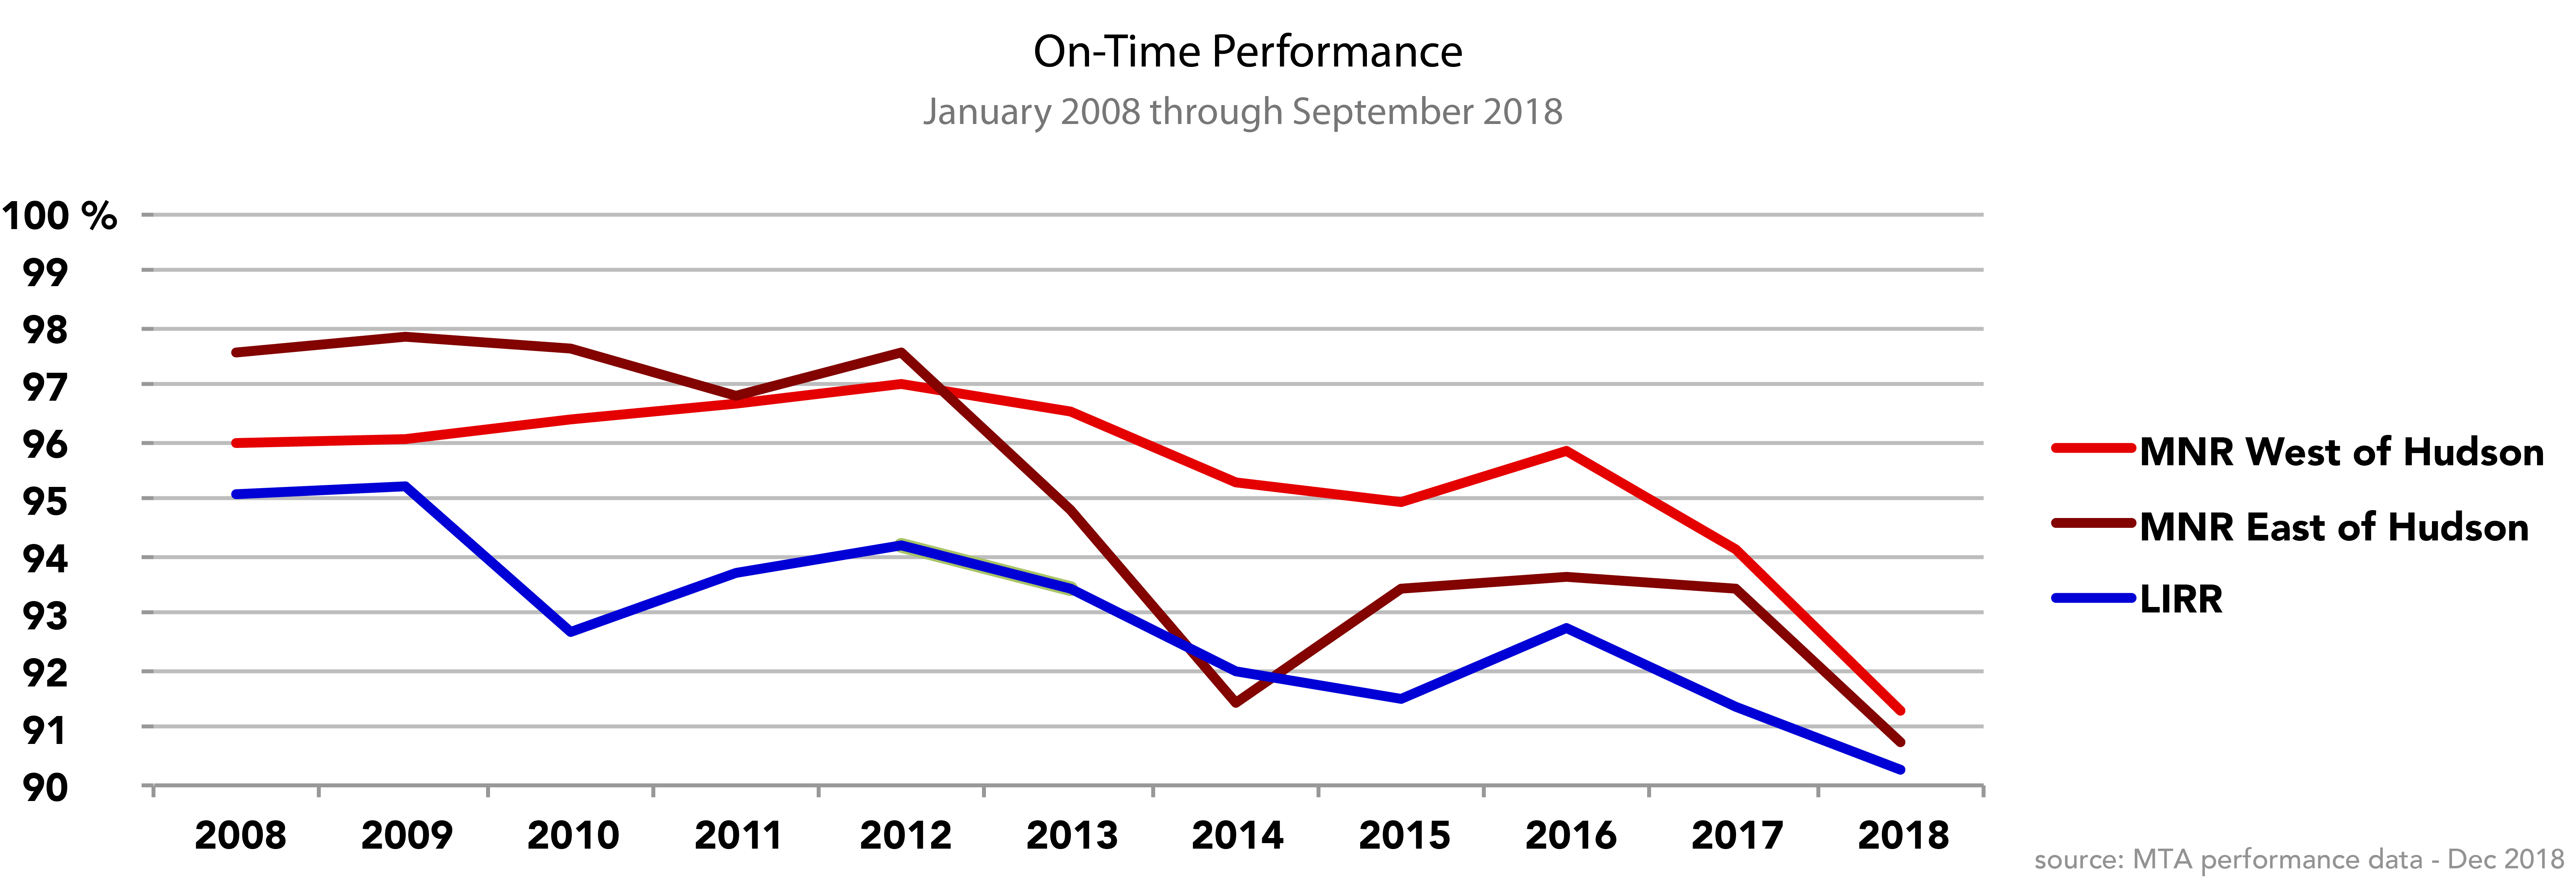
Poor On-Time Performance
On-time performance has declined sharply in the last year and a half. As these trains are vital to NYC and the region, the negative consequences of declining service quality extend beyond the riders. Businesses often place quality of transportation infrastructure high on their list of where to locate. (Partnership for NYC, nytimes “Maybe It’s Not Taxes …”) Unreliable transit inevitably pushes more riders to drive, which only further exacerbates the chronic issues of unhealthy, dangerous, congested, and unreliable streets.
The following chart shows how LIRR and MNR on-time performance peaked in 2009 and has been on a downward trend since. Worse is the fact that delays happen disproportionately during rush hours, meaning that most riders experience significantly worse on-time performance than the annual averages seen in the chart. According to a 2018 LIRR on-time performance report created by State Comptroller DiNapoli’s office, “trains using Penn Station during the morning and evening peaks were 27 percent more likely to be late, canceled or terminated than Penn Station off-peak trains.”
The following chart shows how LIRR and MNR on-time performance peaked in 2009 and has been on a downward trend since. Worse is the fact that delays happen disproportionately during rush hours, meaning that most riders experience significantly worse on-time performance than the annual averages seen in the chart. According to a 2018 LIRR on-time performance report created by State Comptroller DiNapoli’s office, “trains using Penn Station during the morning and evening peaks were 27 percent more likely to be late, canceled or terminated than Penn Station off-peak trains.”
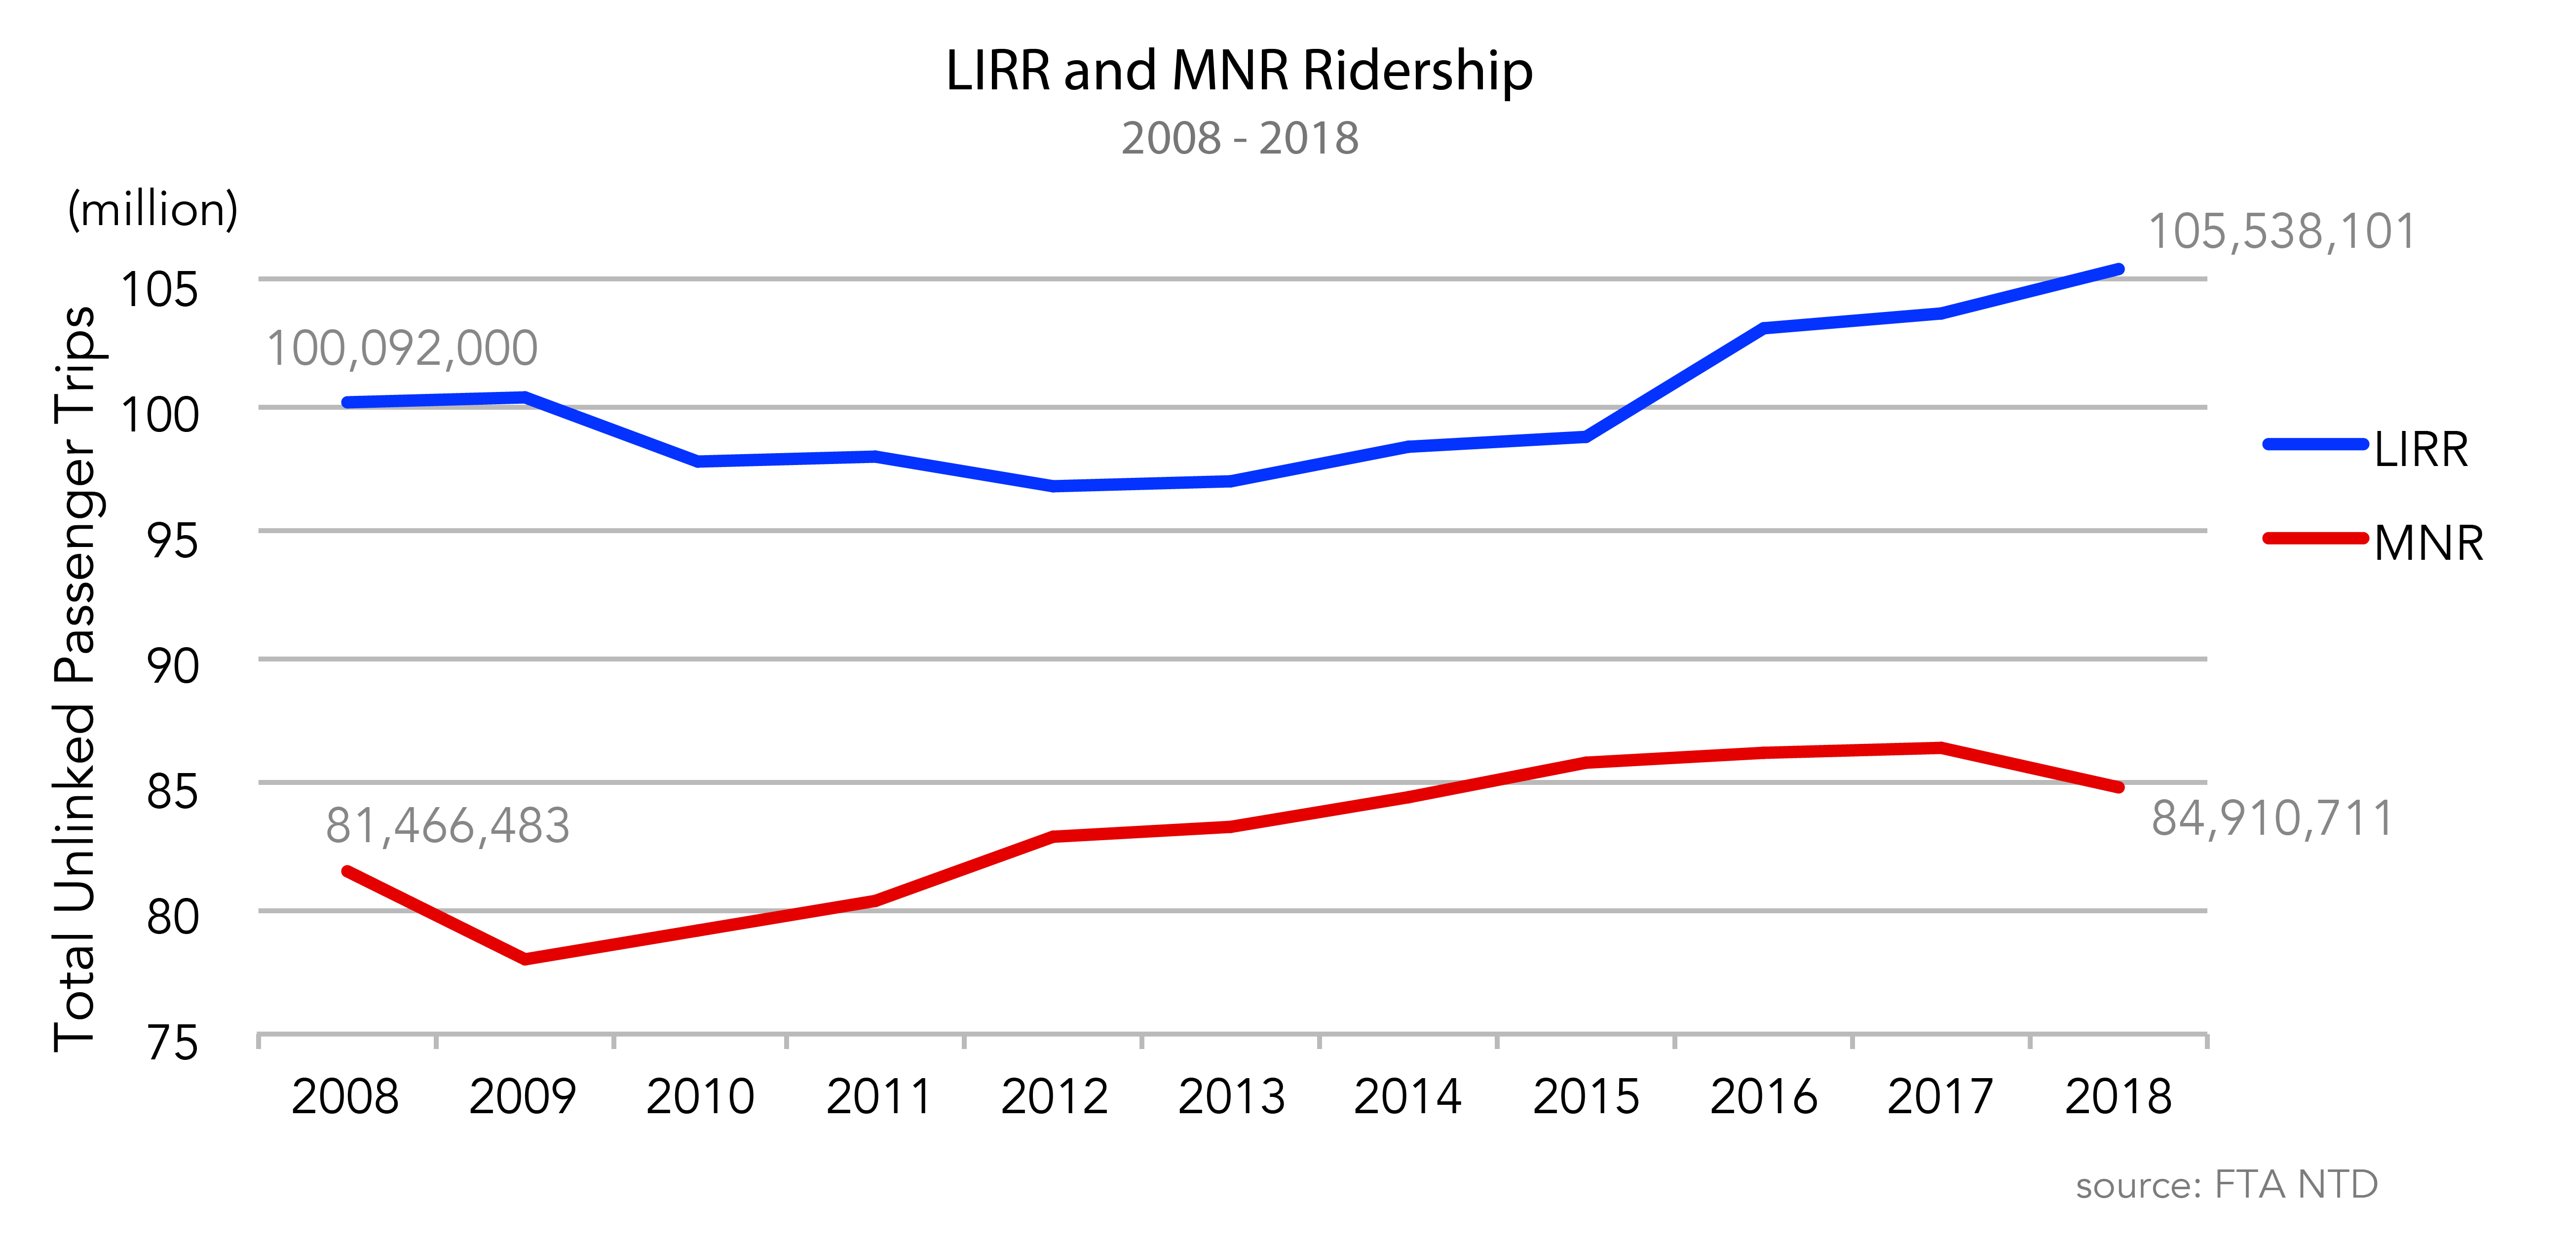
Record High Ridership
Despite worsening service, ridership has continued to grow, a strong sign that riders depend on these train networks. Overcrowding has further stressed agency resources and led to an increase in delays. The LIRR fleet is fully utilized, and so crowded trains and platforms lead to slower loading and unloading (Newsday).
Preventing Delays
The LIRR and MNR are complex train networks that span multiple states, share equipment and railway controlled by various external agencies, move hundreds of thousands of people daily across hundreds of miles of track into train stations with limited capacity. The potential for delays is high. Delays have myriad causes. While some delays are less preventable, such as severe weather and lightning strikes, many delays are caused by failing equipment. While not all failures are predictable or preventable, most are. Ensuring that the MNR and LIRR have the funding, staff, and expertise to manage and maintain equipment inventory well is essential to both the immediate and long-term health of the system. Proper maintenance and regular replacement of equipment that has surpassed its mean useful life costs substantially less money in the long term.
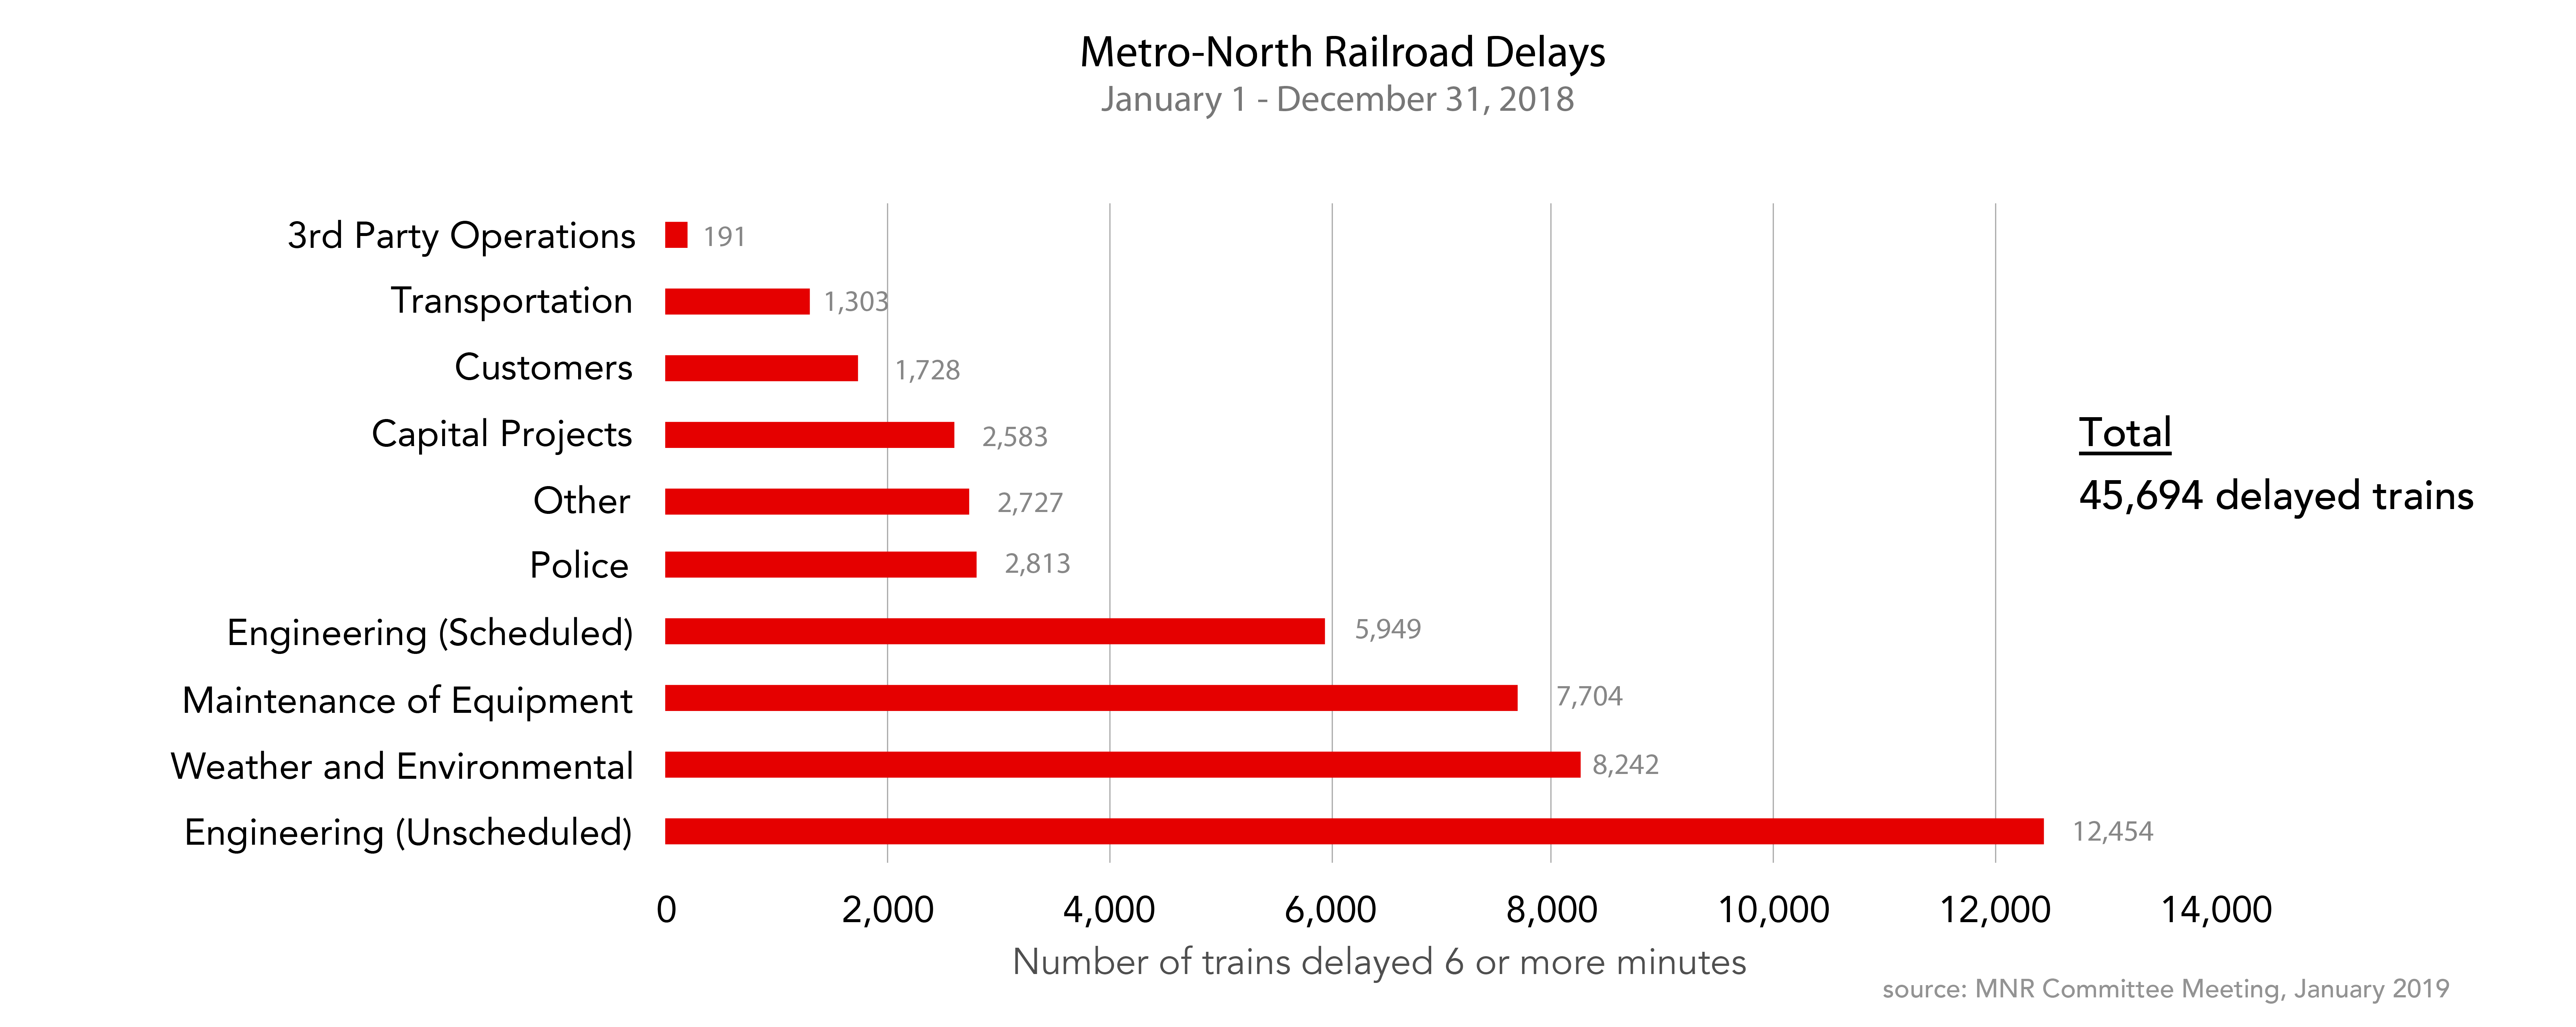
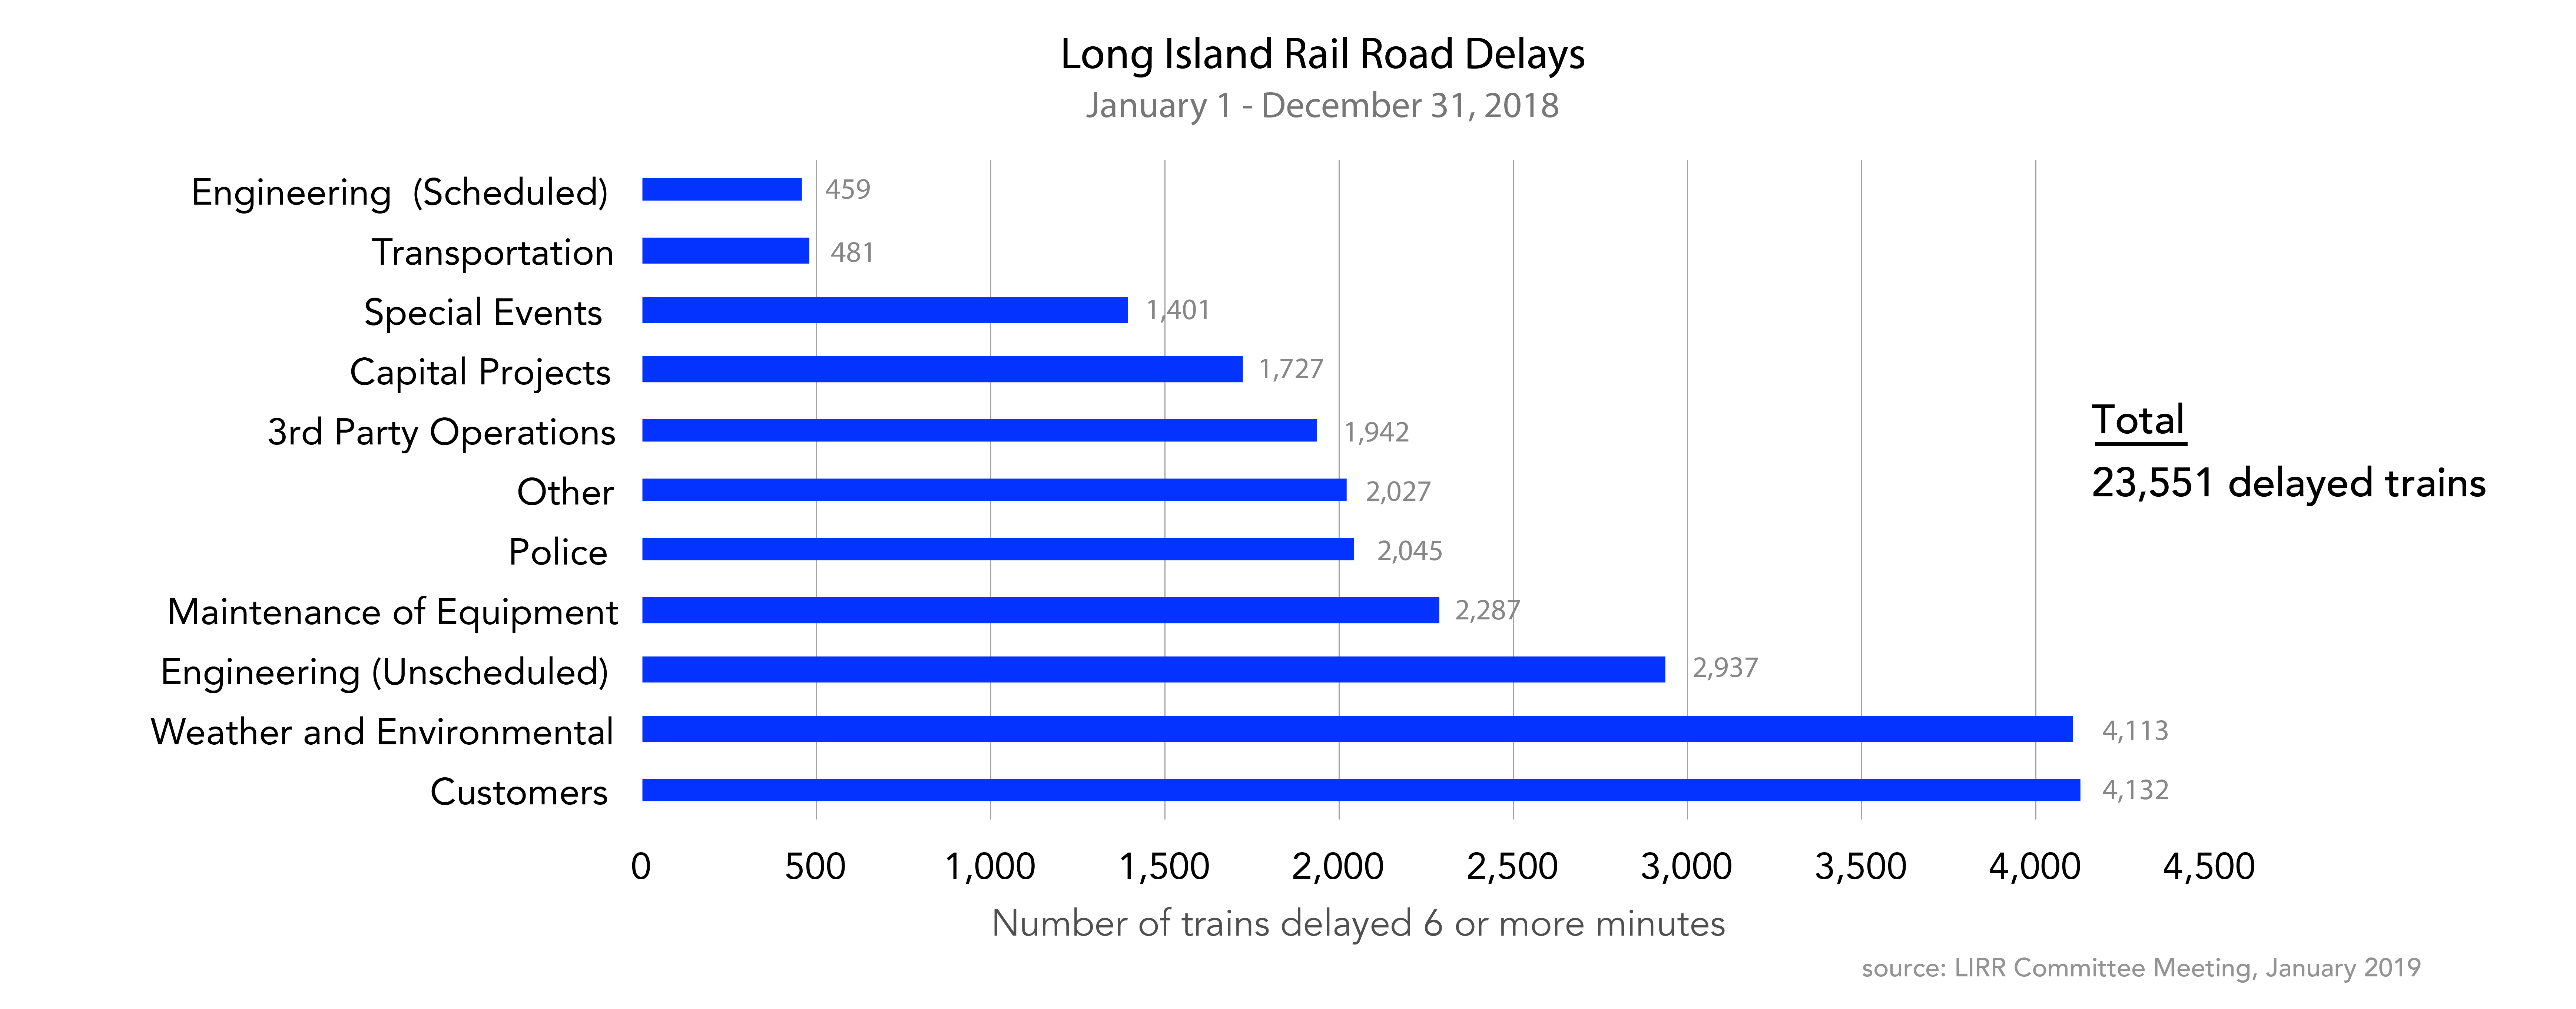
The following charts show the the causes of LIRR and MNR delays in 2018. The most frequent cause of delays on the LIRR is classified as “Customers.” As mentioned above, record high ridership means slower loading and unloading times and crowded platforms not designed to serve so many passengers.
The following charts show the the causes of LIRR and MNR delays in 2018. The most frequent cause of delays on the LIRR is classified as “Customers.” As mentioned above, record high ridership means slower loading and unloading times and crowded platforms not designed to serve so many passengers.
To address the increasing number of delays, the LIRR developed the LIRR Forward Plan (released in May 2018) and the Metro-North Railroad developed the Way Ahead Plan (released in October 2018). These reports highlight plans to fix failing components that cause many delays and provide further insight into why on-time performance has decreased over the last decade. LIRR Forward, for example includes plans to “upgrade 10 switches in the next six months that caused 44% of the 205 switch failures we had in 2017, and conduct comprehensive joint inspections and upgrades on the 370 track circuits that caused 36% of our track-circuit failures.”
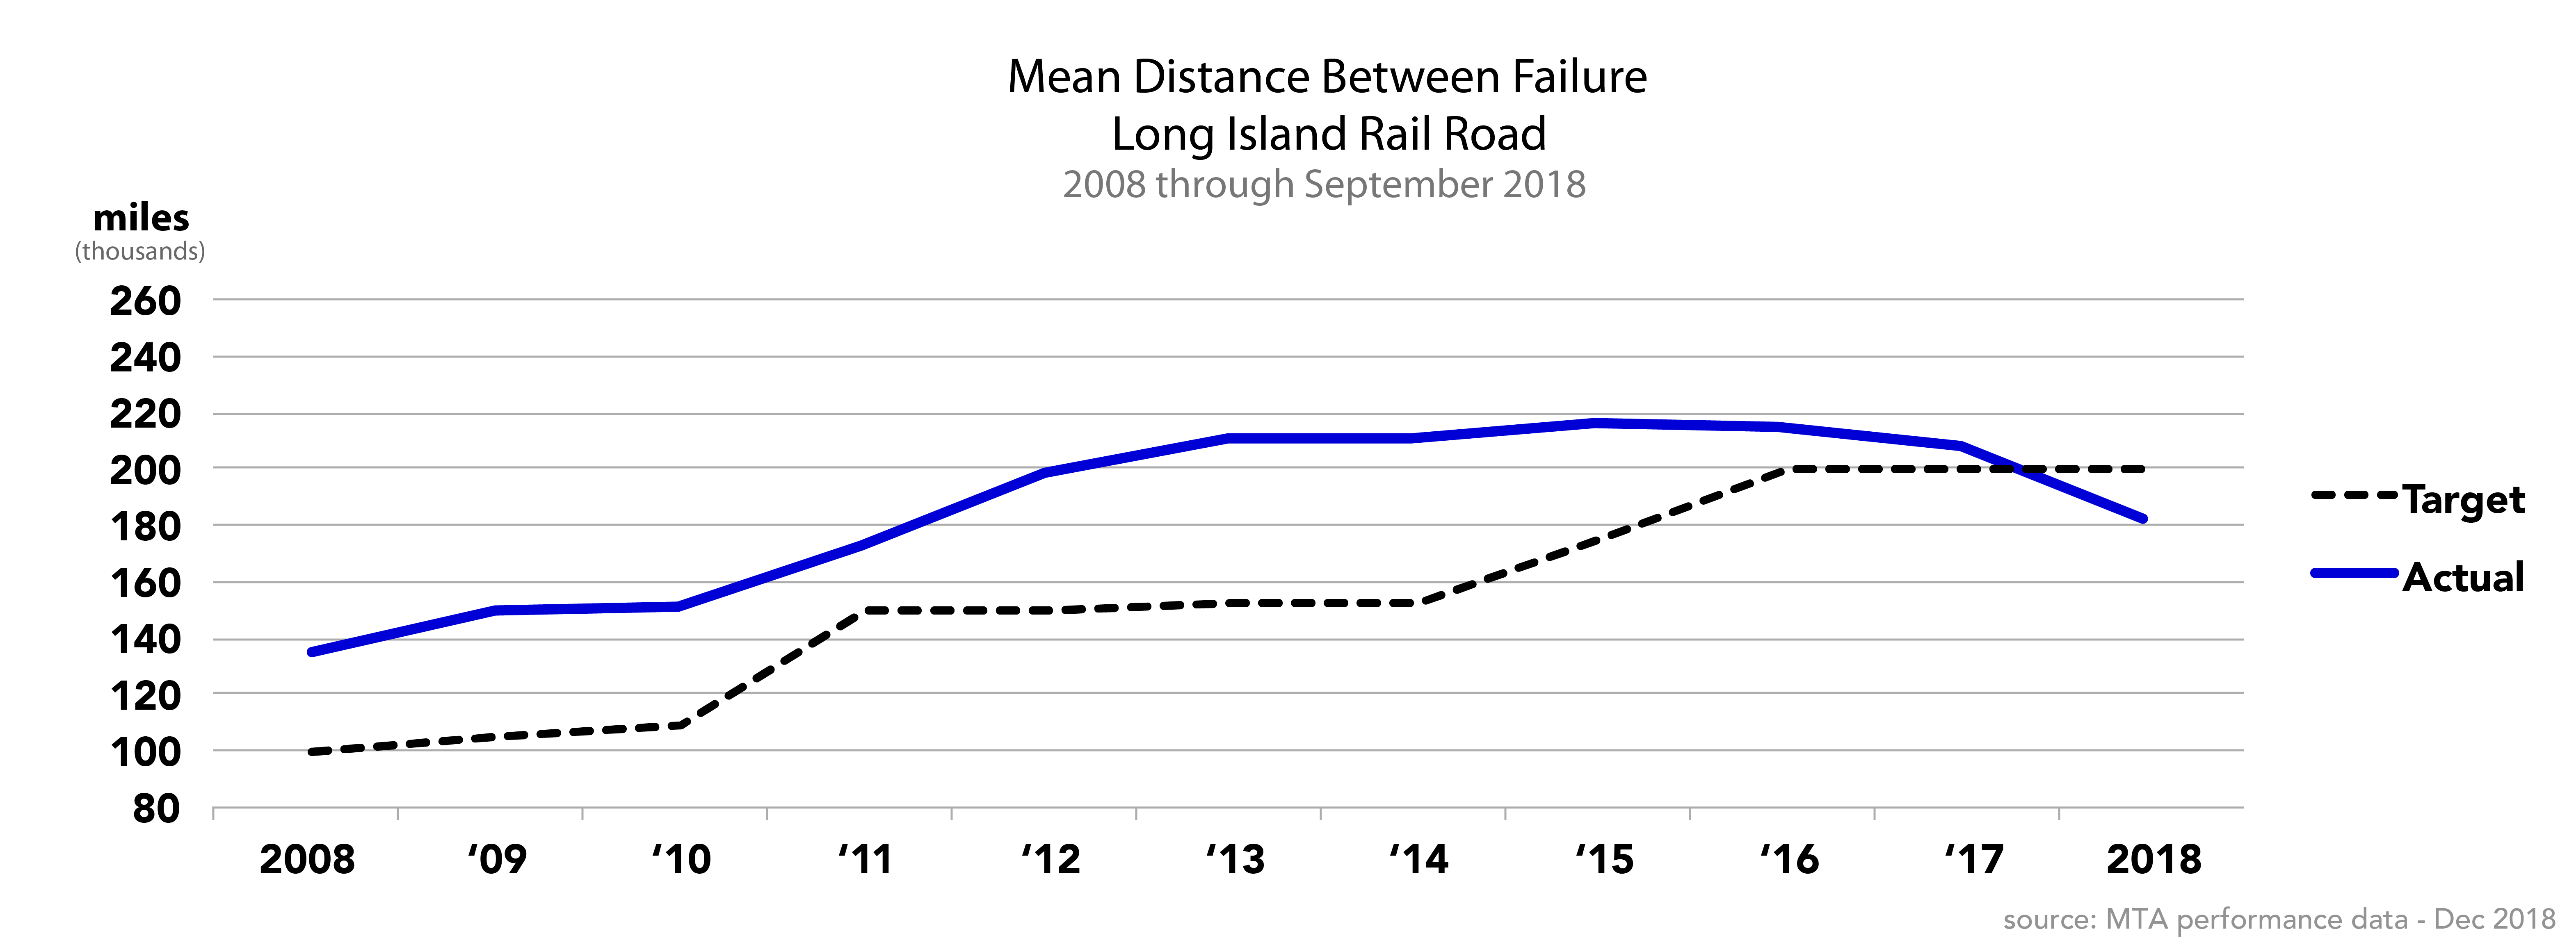
Equipment Reliability
Many delays are caused by failing equipment. While not all failures are predictable or preventable, most are. Ensuring that the MNR and LIRR have the funding, staff, and expertise to manage and maintain equipment inventory well is essential to both the immediate and long-term health of the system. Proper maintenance and regular replacement of equipment that has surpassed its mean useful life costs substantially less money in the long term.
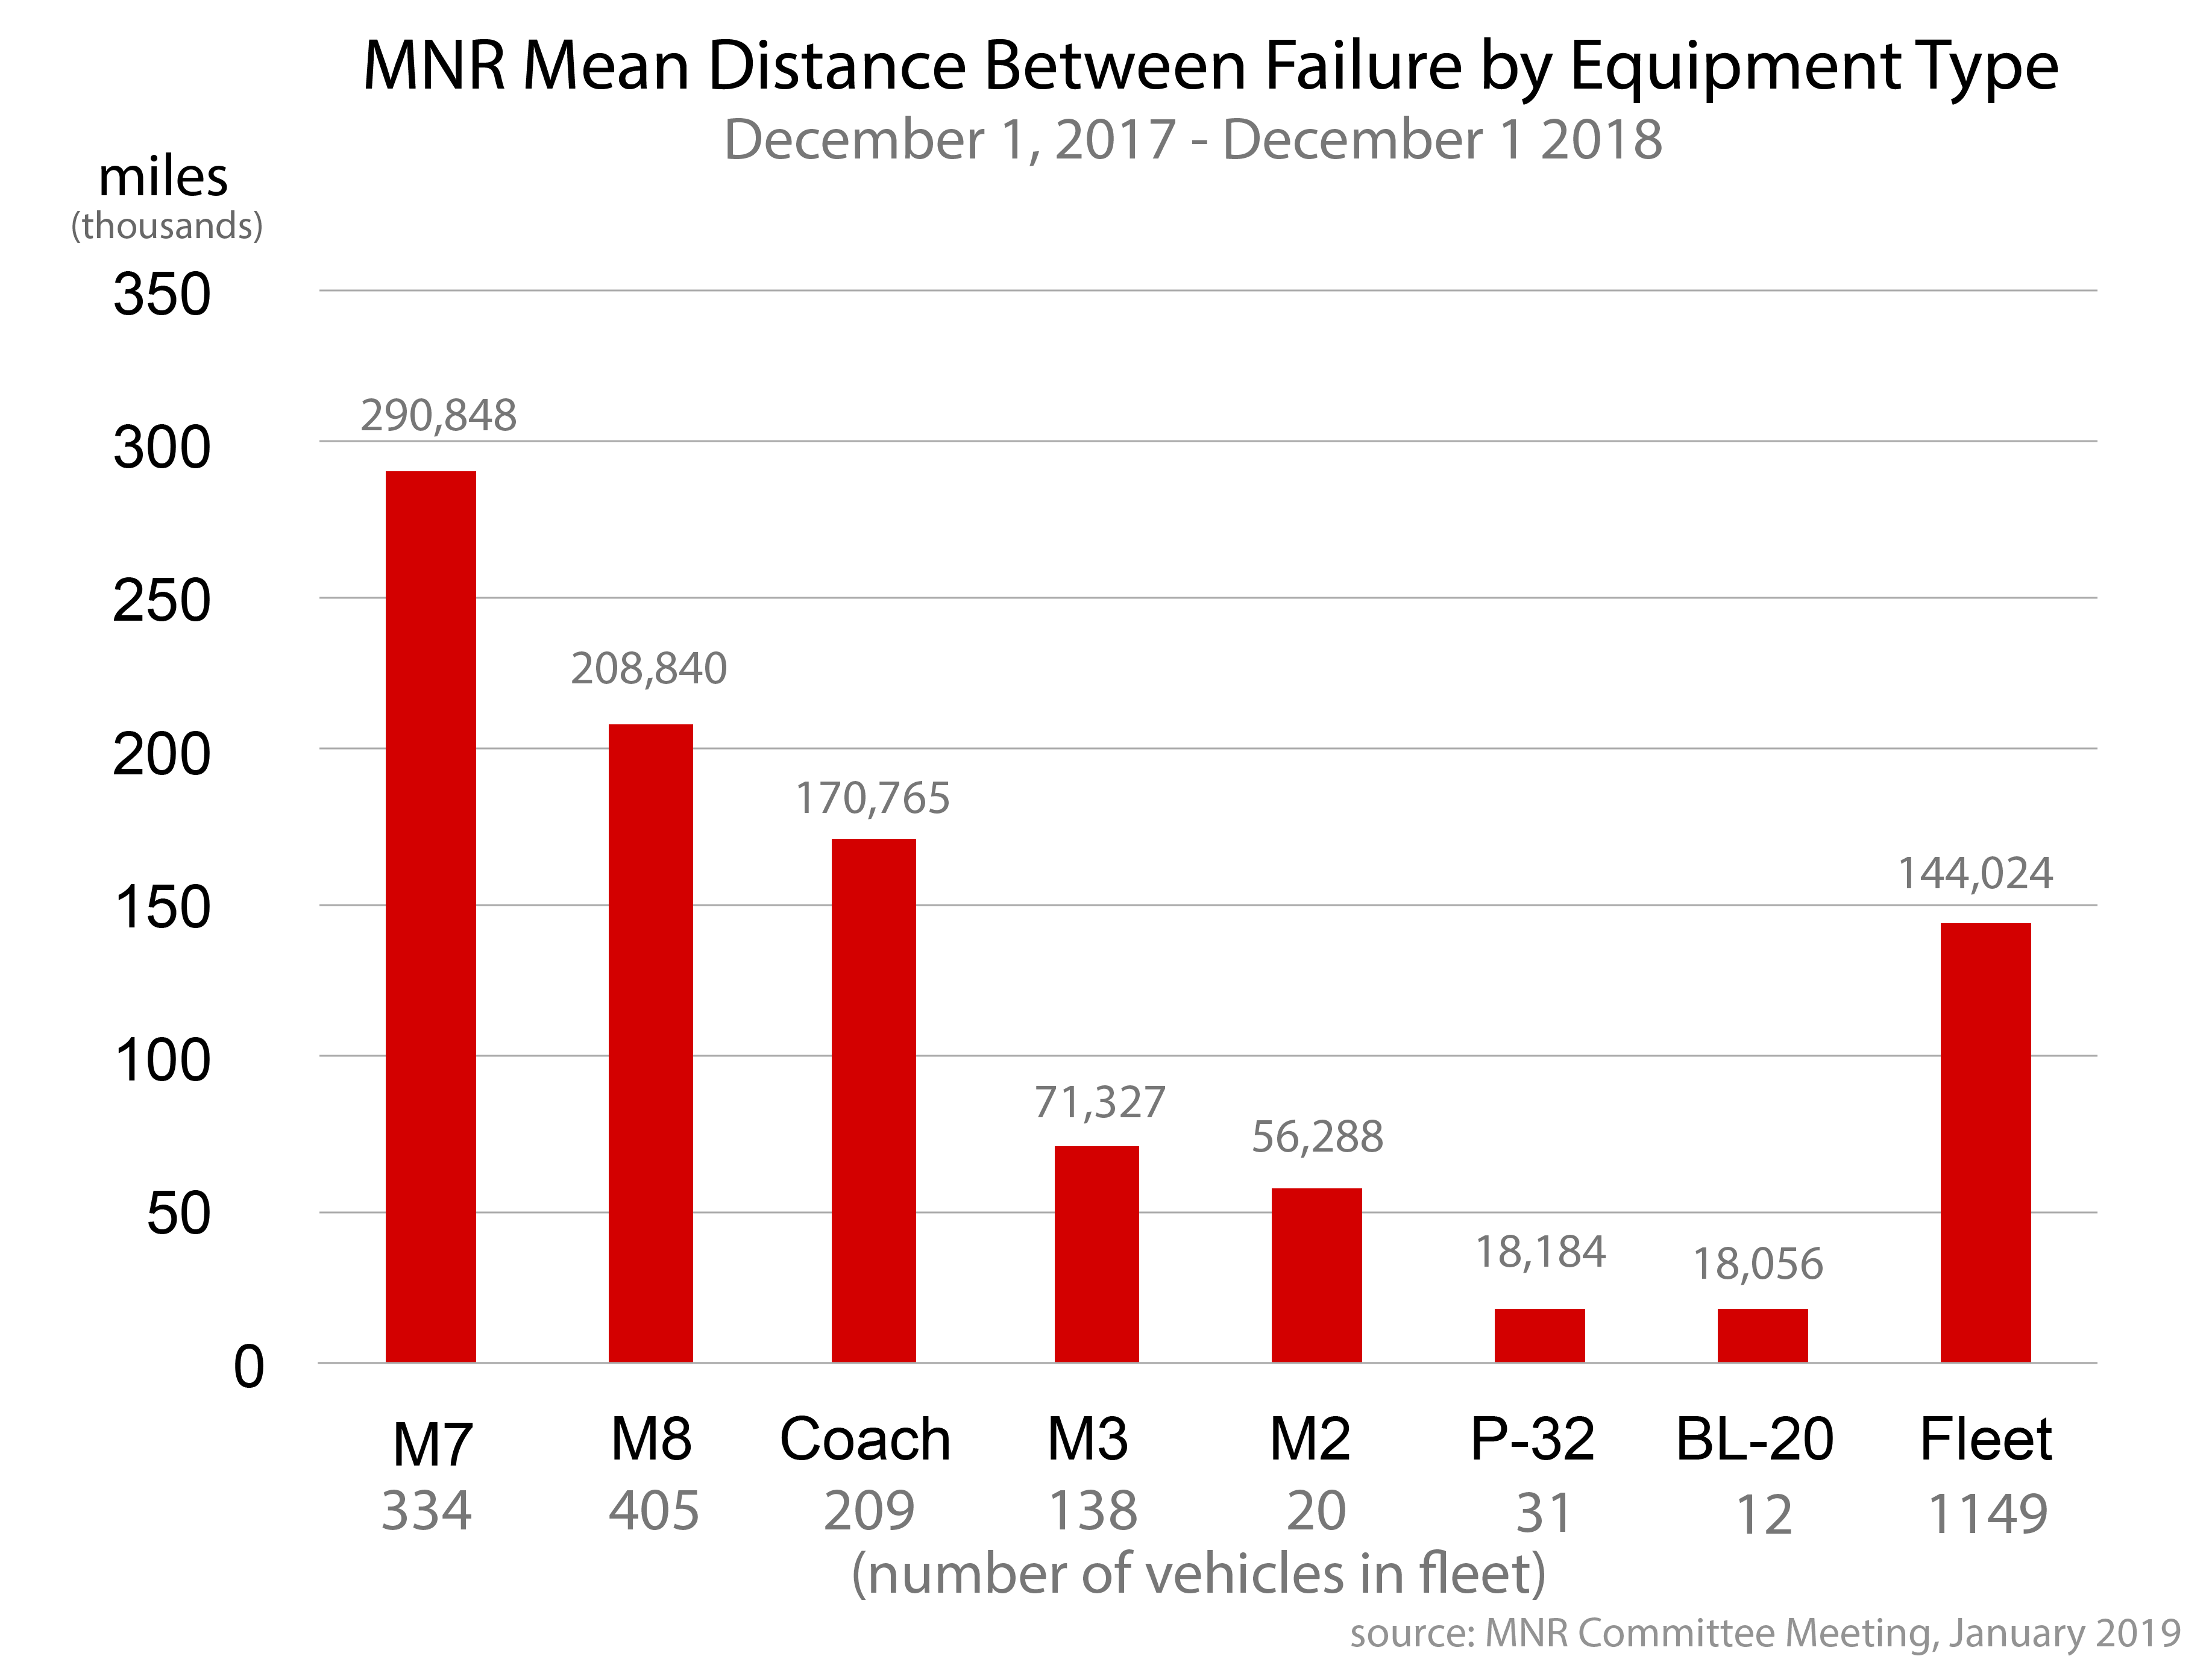
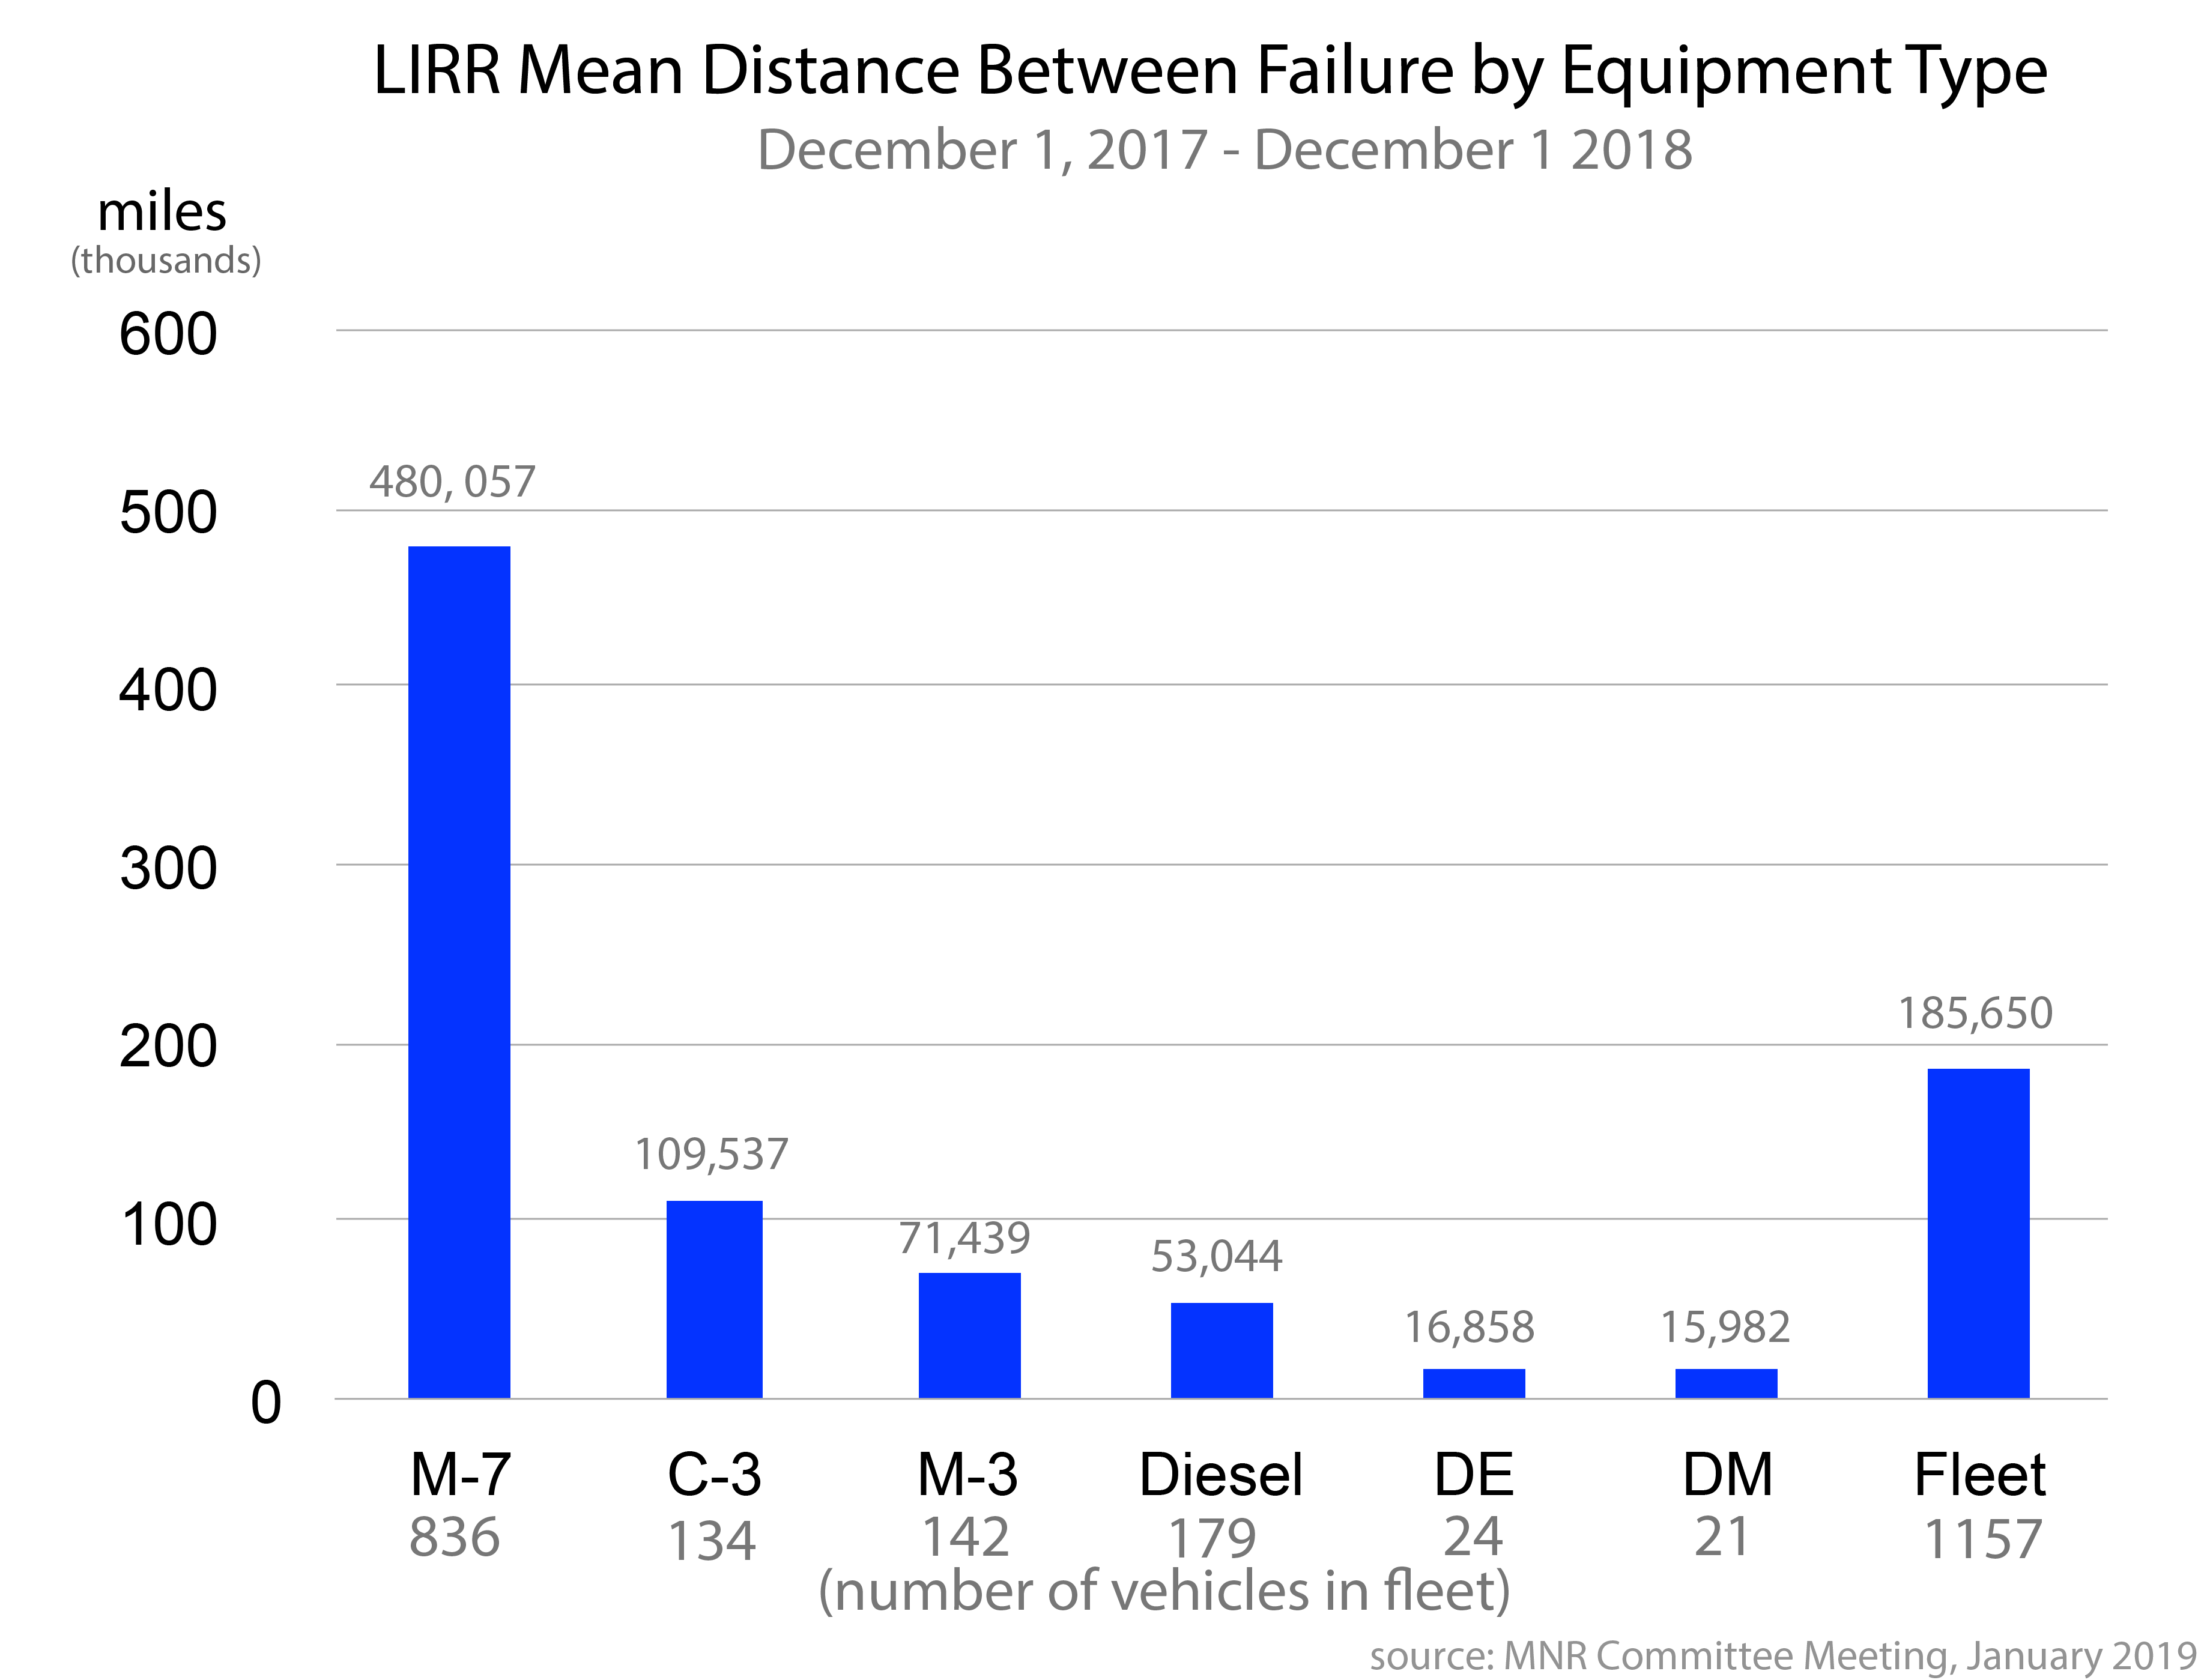
The following charts detail system-wide mean distance traveled between failure statistics, and show how failures have increased within the last few years.
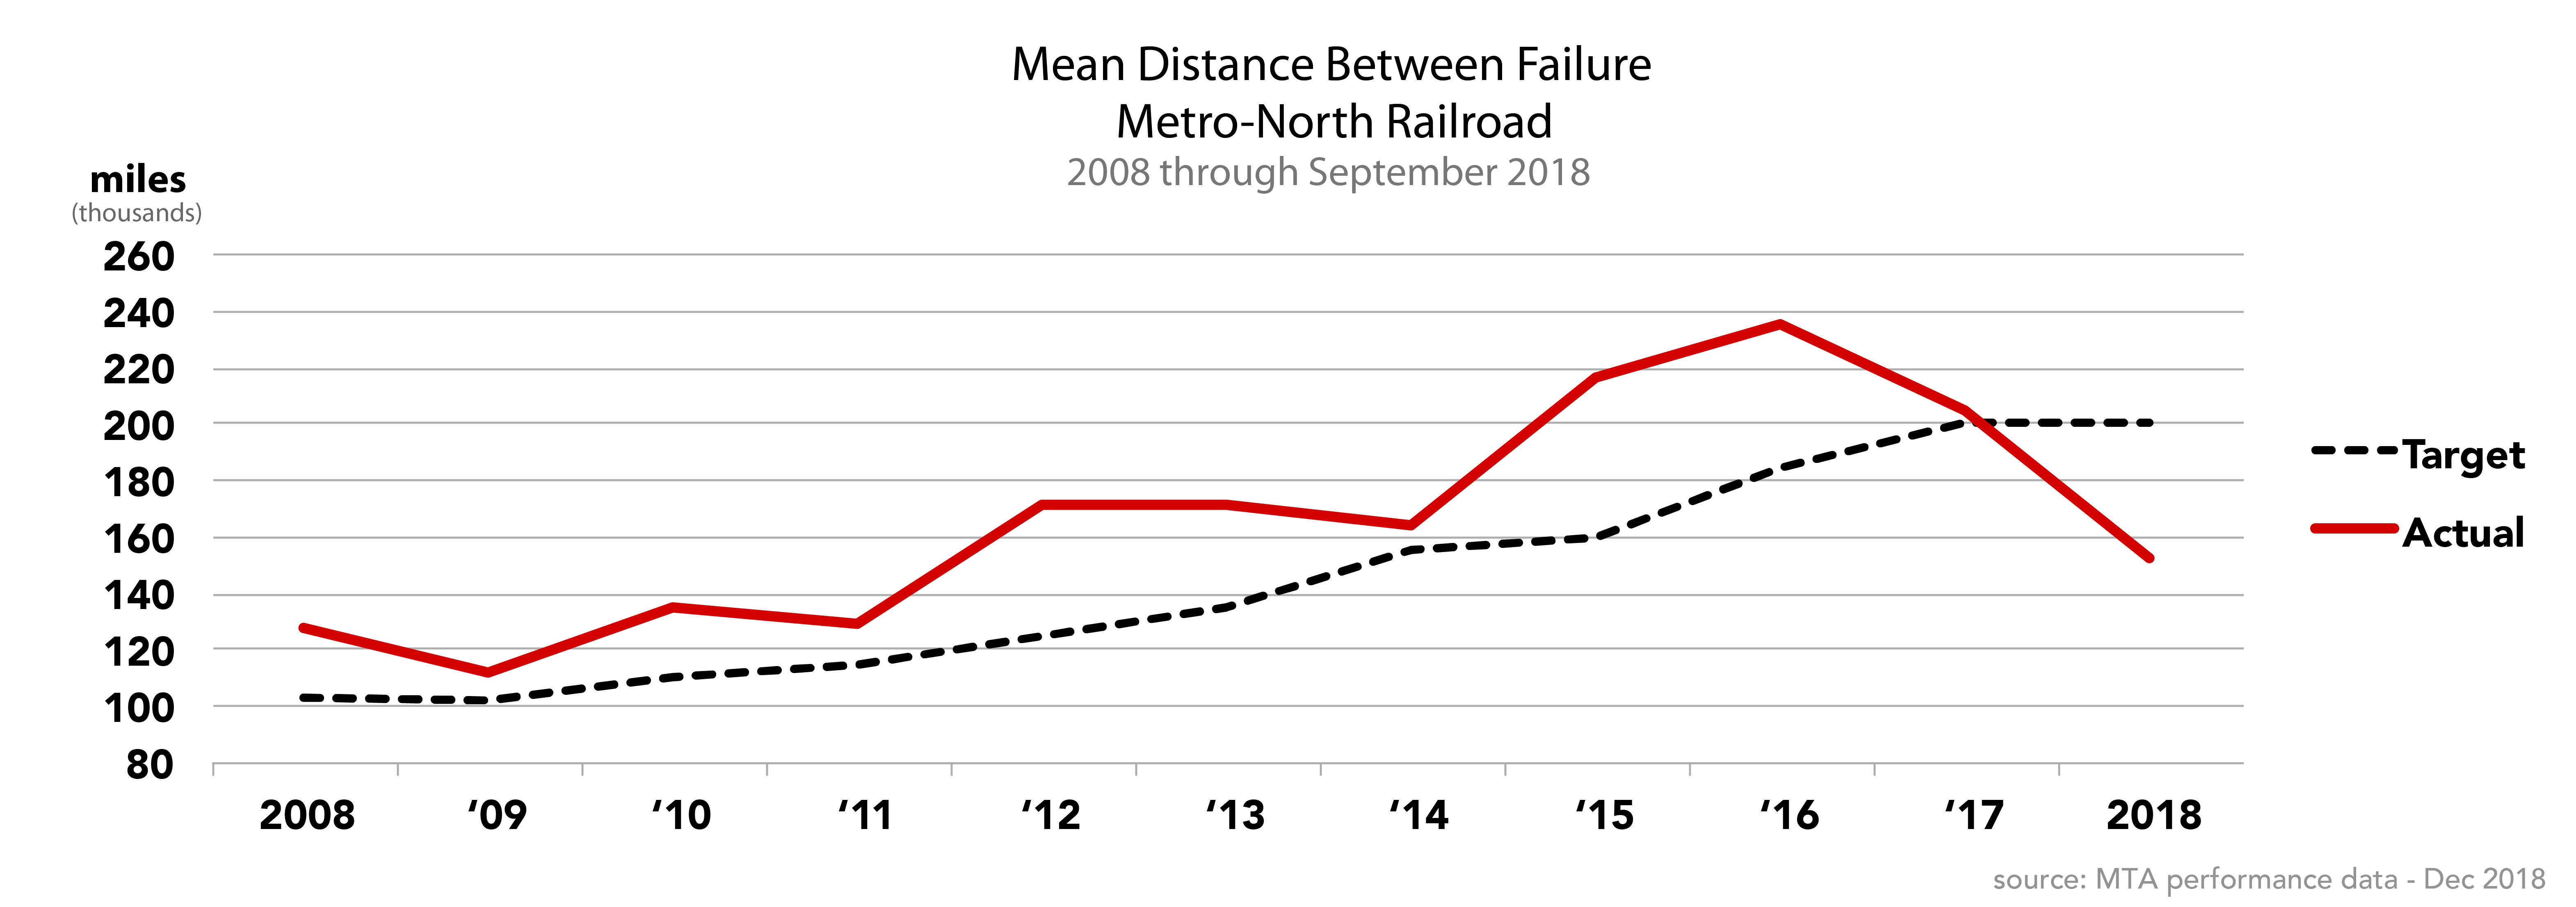
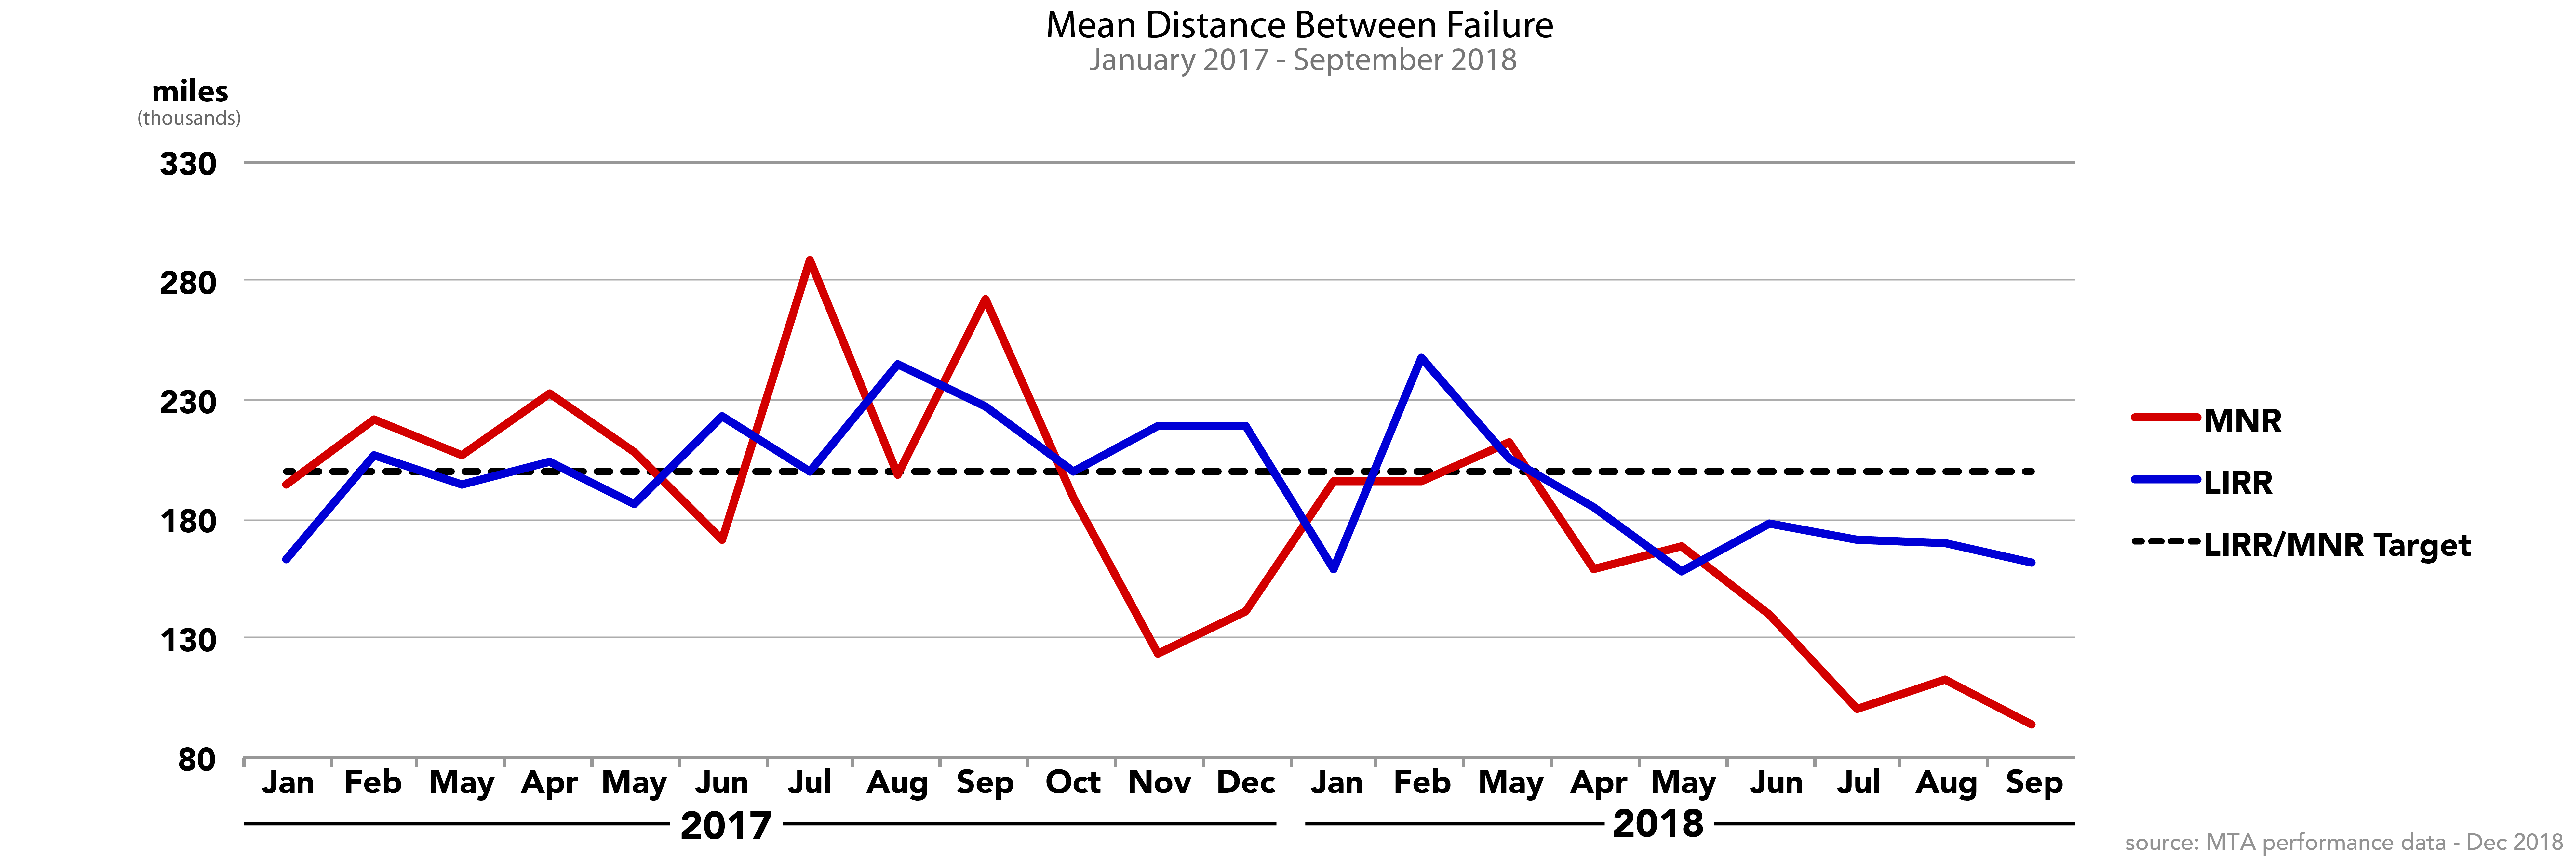
The following charts detail the mean distance traveled between failure for each type of equipment. The higher the value, the more reliable the equipment is. Replacing old, unreliable equipment is paramount to providing reliable service to the areas served by these trains.